

















Perth Crime Statistics 2026: Which Suburbs Have Improved and Where Property Crime Remains Highest Leave a comment
Is Perth safer for property crime than it was one year ago, five years ago or ten years ago?
The official Western Australia Police Force data gives a surprisingly clear answer for one of the offences households worry about most: dwelling burglary has fallen dramatically.
Across the WA Police Metropolitan Region, dwelling burglary fell from 22,305 recorded offences in 2015–16 to 5,312 in 2025–26. Even using the cleaner five-year comparison that sits entirely after the major 2017 recording changes, burglary is down about 50.8% from 2020–21. Every metropolitan police district recorded fewer dwelling burglaries than five years earlier.
The broader picture is more complicated. Selected property offences rose from their pandemic-era low before easing again in the latest year. Property damage increased in 2025–26 even while burglary and stealing fell. Motor vehicle theft is substantially lower than a decade ago, but some southern and outer districts recorded fresh increases during the latest year.
This article uses only official WA Police Force crime statistics and official Australian Bureau of Statistics population information for context. It does not create a proprietary safety score and it does not label a suburb “dangerous” simply because it contains a shopping centre, transport hub or nightlife precinct.
Latest data period
The analysis uses the WA Police Force Crime Time Series Data downloaded from the official crime-statistics page on 21 August 2026. The workbook contains complete financial-year data through 2025–26 and carries a production date of 6 July 2026. WA Police updates its published crime statistics quarterly. Source: WA Police Force Crime Statistics.
The Australian Bureau of Statistics estimates Greater Perth’s population at 2,452,765 at 30 June 2025, after growth of 58,088 people or 2.4% in a year. Perth had the fastest capital-city population growth rate in Australia in 2024–25. The fastest-growing Perth areas included Alkimos–Eglinton, Brabham–Henley Brook and Baldivis–North. Source: ABS Regional Population 2024–25.
The headline: Perth property crime is far below its level a decade ago
Using the WA Police broad selected-property grouping — burglary, motor vehicle theft, stealing, property damage and arson — Metropolitan Region offences fell from approximately 140,485 in 2015–16 to 88,519 in 2025–26, a decline of about 37.0%.
Compared with the previous year, selected property offences fell about 5.8%. Compared with 2020–21, however, the total is about 4.9% higher. That five-year result reflects the unusually low mobility and activity of the pandemic period and is why individual offence trends are more informative than one total.
| Crime category | 2025–26 | 2024–25 | 1-year change | 5-year change | 10-year change |
|---|---|---|---|---|---|
| Dwelling burglary | 5,312 | 6,646 | -20.1% | -50.8% | -76.2% |
| Motor vehicle theft | 3,119 | 3,175 | -1.8% | -17.2% | -55.3% |
| Theft from motor vehicle | 14,434 | 15,625 | -7.6% | -5.2% | Not separately comparable* |
| Property damage | 19,909 | 18,864 | +5.5% | +15.5% | -23.0% |
| Robbery | 1,236 | 1,385 | -10.8% | +14.0% | +2.8% |
| Stealing | 57,113 | 61,896 | -7.7% | +17.0% | -26.5% |
| Assault | 34,729 | 33,574 | +3.4% | +48.8% | +52.2% |
*The detailed “stealing from motor vehicle” subcategory was not separately populated in the 2015–16 detailed stealing breakdown in the current WA Police workbook. The broader stealing category remains available for long-term comparison, but this article does not create a false 2015–16 theft-from-vehicle figure.
Perth burglary has fallen sharply over the decade
Dwelling burglary is the strongest long-term improvement in the data. Metropolitan Perth recorded 5,312 dwelling burglaries in 2025–26, down 20.1% in a single year, 50.8% over five years and 76.2% compared with 2015–16.
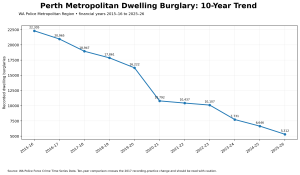
The decline is not limited to the CBD or one affluent corridor. Every metropolitan police district recorded a lower dwelling-burglary count than five years earlier. The largest five-year falls were recorded in Mirrabooka and Cannington districts, both down by more than 60%.
Motor vehicle crime: lower than a decade ago, but not uniform
Stealing of motor vehicles fell from 6,983 offences across the Metropolitan Region in 2015–16 to 3,119 in 2025–26 — a 55.3% decline. The latest year was almost flat, down 1.8%.
Theft from vehicles remains much more common than theft of the vehicle itself. WA Police recorded 14,434 stealing-from-motor-vehicle offences in 2025–26. That was 7.6% lower than the previous year and 5.2% below 2020–21.
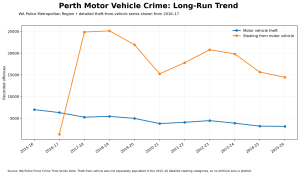
At district level, the current vehicle-theft count is highest in Mandurah (527), Cannington (477), Fremantle (471), Armadale (415) and Midland (409). Counts are not rates, so population size and the number of vehicles exposed need to be considered.
The direction also differs. Armadale vehicle theft rose 16.2% in the latest year and Mandurah rose 8.9%, while Joondalup fell 16.2%, Mirrabooka fell 9.1% and Perth District fell 8.6%.
Where property crime remains highest
The table below uses WA Police police districts rather than pretending that a raw suburb count is a risk ranking. It shows current volume for the main household-relevant categories.
| Police district | Selected property offences | Dwelling burglary | Motor vehicle theft | Theft from vehicle | Property damage |
|---|---|---|---|---|---|
| Cannington | 14,007 | 684 | 477 | 3,093 | 2,902 |
| Mandurah | 12,986 | 1,071 | 527 | 1,647 | 3,035 |
| Fremantle | 12,815 | 774 | 471 | 2,183 | 2,592 |
| Armadale | 11,508 | 750 | 415 | 1,785 | 2,833 |
| Mirrabooka | 10,715 | 559 | 350 | 2,044 | 2,372 |
| Midland | 9,206 | 627 | 409 | 1,050 | 2,387 |
| Perth | 8,836 | 355 | 169 | 1,418 | 1,541 |
| Joondalup | 8,446 | 492 | 301 | 1,214 | 2,247 |
Source: WA Police Force Crime Time Series Data, financial year 2025–26.
Cannington currently records the largest selected-property total among the eight metropolitan districts, followed closely by Mandurah and Fremantle. But the offence mix differs substantially. Mandurah has the highest dwelling-burglary and motor-vehicle-theft counts; Cannington has the highest theft-from-vehicle count; Armadale and Mandurah record particularly large property-damage volumes.
Perth’s Most Improved Suburbs
This is the section where a crime-statistics article can most easily become misleading.
WA Police’s interactive Power BI crime-statistics report allows users to filter and compare suburbs/localities, and WA Police explicitly identifies the Power BI report as the suburb-comparison tool. However, the official downloadable long-run workbook used for reproducible analysis in this article is published at WA, Region and police-district level rather than as a suburb-by-suburb export.
For that reason, Security Wholesalers does not take a district-wide decline and falsely claim that every suburb inside that district improved by the same amount. The defensible long-run finding is the district result below. Readers wanting an individual suburb can verify it using the official WA Police interactive report linked from the WA Police Crime Statistics page.
| Police district | 2020–21 dwelling burglary | 2025–26 dwelling burglary | Five-year change |
|---|---|---|---|
| Mirrabooka | 1,534 | 559 | -63.6% |
| Cannington | 1,836 | 684 | -62.7% |
| Joondalup | 995 | 492 | -50.6% |
| Perth | 715 | 355 | -50.3% |
| Armadale | 1,472 | 750 | -49.0% |
| Fremantle | 1,509 | 774 | -48.7% |
| Midland | 1,199 | 627 | -47.7% |
| Mandurah | 1,532 | 1,071 | -30.1% |
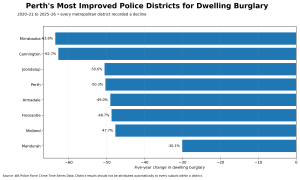
Mirrabooka District recorded the largest five-year percentage improvement, down 63.6%, followed by Cannington at 62.7%. Joondalup and Perth District both roughly halved their dwelling-burglary totals.
This is genuinely useful good news: the improvement is broad, sustained and visible across inner, northern, southern and eastern parts of metropolitan Perth rather than being confined to one pocket.
Which areas changed most in the latest year?
| Police district | 2024–25 selected property offences | 2025–26 selected property offences | One-year change |
|---|---|---|---|
| Mandurah | 12,159 | 12,986 | +6.8% |
| Armadale | 11,434 | 11,508 | +0.6% |
| Mirrabooka | 11,042 | 10,715 | -3.0% |
| Joondalup | 8,858 | 8,446 | -4.7% |
| Fremantle | 13,719 | 12,815 | -6.6% |
| Midland | 9,983 | 9,206 | -7.8% |
| Cannington | 16,285 | 14,007 | -14.0% |
| Perth | 10,459 | 8,836 | -15.5% |
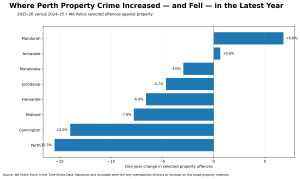
Only Mandurah (+6.8%) and Armadale (+0.6%) increased on the broad selected-property measure. Perth District recorded the largest decline at 15.5%, followed by Cannington at 14.0%.
That does not make Perth District “safest”. Inner Perth has a large daytime and nighttime user population, entertainment venues, retail activity, public transport and visitors. A residential population denominator can therefore be a poor proxy for the number of people and properties actually exposed to crime.
Perth metropolitan property-crime map
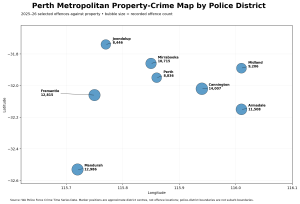
The map reinforces the difference between volume and risk. The southern half of the metropolitan police region contains more districts and a large share of Perth’s growth corridors. ABS data shows especially rapid population growth in Alkimos–Eglinton in the north, Brabham–Henley Brook in the north-east and Baldivis–North in the south. Growing populations mean more households, cars, retail premises and potential offence locations, so raw-count changes should never be interpreted without that context.
North versus South: what is actually different?
There is no single official WA Police “north versus south” crime rate. For this graphic, the police districts are grouped solely to compare the composition of recorded property crime: North is Joondalup plus Mirrabooka; South is Armadale, Cannington, Fremantle and Mandurah; East is Midland; and Inner is Perth District.
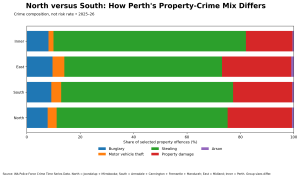
Stealing dominates every part of the metro region. The inner district has the largest proportional concentration of stealing, consistent with the much greater concentration of retail, nightlife, transport and visitor activity. Burglary accounts for a larger share of the southern and eastern property mix than it does in the inner district.
The practical conclusion is more useful than a north-versus-south stereotype: households should look at the offence mix relevant to their property rather than assuming an entire side of Perth has one risk profile.
What does Perth crime look like right now?
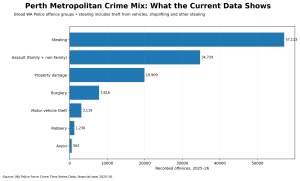
Stealing remains the largest property category by a wide margin. Within that group, the latest data includes 21,598 shoplifting offences, 14,434 theft-from-vehicle offences, 6,117 stealing-from-dwelling offences and 14,850 stealing-from-other-premises-or-place offences.
Assault is included in the graphic because it is relevant to the overall crime picture, but it should not be combined with property offences when assessing household burglary or vehicle exposure.
Why inner Perth and major retail centres can look worse than ordinary suburbs
WA Police itself warns that crime statistics are influenced by population, infrastructure such as shopping centres and entertainment precincts, seasonal patterns and the extent to which offences are reported or detected.
This is especially important for Perth CBD, Northbridge, major shopping centres, entertainment precincts and transport interchanges. Large numbers of workers, shoppers, students and visitors can generate recorded offences without appearing in the resident-population denominator.
A high shoplifting count near a major shopping centre is therefore not equivalent to a high residential burglary rate. Likewise, a CBD stealing count may say more about foot traffic, retail activity and nightlife exposure than about the probability of a resident’s home being burgled.
Methodology: the 2017 break in WA Police crime statistics
WA Police commissioned an independent ABS review of its crime-statistics processes in 2016 and implemented recording and reporting changes between May and November 2017. WA Police explicitly states that comparisons should be made with caution when they cross this period or overlap it.
The changes included adoption of ANZSOC 2011, changes to offence outcome statuses and changes designed to reduce over-reporting of facilitation and duplicated offences. For example, damage caused solely to gain entry during a burglary is not necessarily counted as a separate property-damage offence under the revised approach.
WA Police’s archived-report page also warns that pre-2017 archived reports are not comparable with current reporting and says the current Crime Time Series workbook applies revised offence classifications and reporting processes retrospectively to prior data. Source: WA Police archived crime-statistics reports.
There is still an important distinction: some recording-practice changes took effect prospectively. That is why the ten-year results in this article are shown, but the strongest claims about sustained improvement rely on the five-year 2020–21 to 2025–26 comparison, which is fully on the post-2017 side of the break.
WA Police statistics count recorded offences, not unique victims or offenders. One incident can contain multiple offences and one person can be associated with multiple offences. Counts are also subject to revision as investigations progress.
Population-adjusted rates are useful only when the offence geography and population geography match. ABS estimates Greater Perth at 2.45 million people, but WA Police’s Metropolitan Region and police-district boundaries are policing geographies rather than ABS GCCSA or suburb boundaries. This article therefore does not divide district counts by a mismatched Greater Perth population and call the result a suburb crime rate.
What the data means for Perth households
The long-run fall in dwelling burglary is encouraging, but 5,312 metropolitan dwelling burglaries in a year is not zero. The current offence mix suggests a practical focus on the specific access points associated with detached and suburban housing.
For houses, priorities include strong external-door and window locking, visible side-gate security, garage security, lighting around access paths and avoiding obvious opportunities created by unlocked doors or open garages. WA Police publishes dedicated burglary-prevention and home-security resources through its Protect My Property guidance.
For vehicles, the current 14,434 theft-from-vehicle offences are particularly relevant. WA Police advises drivers to park in well-lit and secure areas where possible, remove valuables, lock the vehicle and keep keys secure even when at home. Source: WA Police Protect My Wheels.
Apartments and dense inner precincts have a different exposure pattern: common parking areas, visitor access, storage areas and high foot traffic can matter more than side gates or rear-yard access. Retail businesses should focus more heavily on shoplifting and after-hours access, while workshops and warehouses should consider perimeter entry, vehicles, tools and stock.
Cameras, alarms and access control can form part of that response, but the statistics do not support treating every suburb the same. The most useful security plan responds to the offence pattern, the property design and the way the site is actually used.
The bottom line
Perth is materially better on dwelling burglary than it was five and ten years ago. That is the clearest finding in the official data and deserves more attention than another “worst suburb” list.
Motor vehicle theft is also well below its 2015–16 volume, although recent increases in Armadale and Mandurah show why citywide improvement does not mean every local area is moving in the same direction. Theft from vehicles remains a high-volume problem. Property damage increased in the latest year even as total selected property offending fell.
And the biggest statistical lesson is methodological: crime counts describe where offences were recorded, not a universal probability that a resident will become a victim. Population, growth, shopping centres, transport hubs, nightlife and visitor activity all change what a raw count means.
For residents, researchers and property buyers, the most useful question is not “Which Perth suburb is dangerous?” It is: Has the offence relevant to this property been improving or worsening, and is the apparent change real after accounting for geography and the way the area is used?