

















Brisbane Crime Statistics 2026: Break-Ins, Car Theft and the Suburbs Changing Fastest Leave a comment
Where is property crime actually occurring across Brisbane, and how has that changed over the past decade?
That question produces a more useful answer than a simple list of “safe” and “dangerous” suburbs.
Queensland Police Service data shows that Brisbane City’s overall property-crime volume is now broadly flat compared with a year ago, but the mix of offences has shifted considerably. Residential unlawful entry has fallen sharply from its recent peak. Theft from vehicles is also lower in the latest year. Motor vehicle theft, however, remains around twice its level a decade ago, while shop stealing has increased strongly and is increasingly important to the property-crime totals of major retail areas.
This matters because Brisbane is not one uniform crime environment. A detached house in an outer suburb has a different exposure profile from a CBD apartment, a car parked beside a transport hub, or a shopping-centre tenancy. Raw offence counts can also make activity centres look extreme because large numbers of commuters, shoppers and visitors use them without being included in the local resident-population denominator.
Data period used in this analysis
Security Wholesalers downloaded the official Queensland Police Service reported-offence number and rate files on 21 August 2026. The latest month present in the files is July 2026, so the principal current period in this article is the rolling 12 months from 1 August 2025 to 31 July 2026. Comparisons use the equivalent 12-month periods ending July 2025, July 2021 and July 2016. Source: Queensland Police Service Maps and Statistics.
For geographic context, the article distinguishes Brisbane City Council from the broader metropolitan area. Greater Brisbane had an estimated resident population of 2,833,524 at 30 June 2025, according to the Australian Bureau of Statistics. The wider capital-city region includes large adjoining councils such as Logan, Moreton Bay, Redland and Ipswich, which are shown separately rather than folded into Brisbane City figures. Source: ABS Regional Population 2024–25.
Brisbane crime snapshot: what changed in the latest year?
| Crime category | Aug 2025–Jul 2026 | Aug 2024–Jul 2025 | 1-year change | 5-year change | 10-year change |
|---|---|---|---|---|---|
| Unlawful entry | 9,593 | 11,482 | -16.5% | +1.9% | +32.0% |
| Residential unlawful entry | 5,100 | 6,188 | -17.6% | -8.3% | +5.3% |
| Motor vehicle theft | 4,955 | 4,995 | -0.8% | +34.3% | +120.9% |
| Theft from / enter vehicle | 7,953 | 8,604 | -7.6% | +8.0% | +51.1% |
| Property damage | 7,575 | 7,419 | +2.1% | +24.8% | +25.9% |
| Robbery | 783 | 807 | -3.0% | +14.1% | +109.9% |
| Assault | 9,909 | 9,796 | +1.2% | +102.2% | +193.9% |
| Shop theft | 16,500 | 14,430 | +14.3% | +118.8% | +190.1% |
Source: QPS Brisbane City Council reported-offence data. Five-year comparison: August 2020–July 2021. Ten-year comparison: August 2015–July 2016.
The latest figures tell a mixed story. Residential unlawful entry fell 17.6% in the latest year and is 8.3% below its five-year comparison point. Theft from or unlawful entry into vehicles fell 7.6% year-on-year. By contrast, shop stealing increased 14.3% and property damage increased 2.1%.
Motor vehicle theft was almost unchanged in the latest year, with 4,955 offences compared with 4,995 previously. That apparent stability should not obscure the long-term change: the latest total is 120.9% above the equivalent 2016 period.
Five-year comparisons require caution because August 2020–July 2021 contains COVID-era restrictions that changed travel, retail, nightlife and commuting patterns. The ten-year series is therefore particularly useful for separating pandemic rebounds from longer structural change.
Ten years of Brisbane property crime
QPS’s official Offences Against Property category recorded 73,150 offences across Brisbane City Council in the latest 12 months. That was only 0.7% more than the previous 12 months, but 54.8% higher than the equivalent period ending July 2016.
Population growth explains part — but not all — of that increase. QPS’s population-adjusted property-offence rate rose from approximately 4,016.5 per 100,000 residents in the 12 months ending July 2016 to 5,270.6 in the latest period, an increase of about 31.2%. Compared with the previous year, however, the current population-adjusted rate is slightly lower.
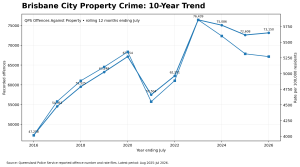
The chart also shows why 2021 should not be treated as a normal baseline. Property offending fell sharply during the pandemic period and then rebounded. The 2026 level is below the 2023 peak, but it remains well above the first half of the decade.
Where are residential break-ins occurring?
QPS recorded 5,100 Unlawful Entry With Intent – Dwelling offences across Brisbane City in the latest 12 months. This is the most useful reproducible bulk-data measure for residential break-in in the QPS tables.
The public bulk file separately identifies dwelling entries without violence and with violence, but it does not provide a standalone “attempted residential entry” field. QPS’s online reporting process explicitly accepts attempted break-and-enter reports, but this article does not invent an attempted-entry statistic that is not separately exposed in the open table. Source: QPS break-and-enter reporting information.
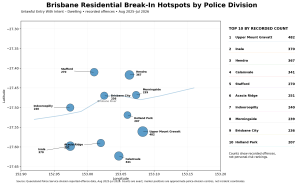
The highest current counts were recorded in Upper Mount Gravatt (482), Inala (370), Hendra (367), Calamvale (341) and Stafford (270). These are police-division areas, not suburb boundaries, so they should be interpreted as local policing geographies rather than a suburb “danger ranking”.
Upper Mount Gravatt is a particularly useful example of why context matters. Its police division includes a major shopping and transport environment as well as residential neighbourhoods. The division can therefore rank highly across different offence types for different reasons.
Motor vehicle theft: Brisbane’s biggest long-run household shift
Vehicle theft deserves particular attention in Brisbane because the housing stock often combines detached homes, driveways, garages, side access and multiple household vehicles.
Brisbane City recorded 4,955 unlawful-use-of-motor-vehicle offences in the latest year. That was 0.8% below the previous year but 34.3% above the five-year comparison and 120.9% above the equivalent 2016 period.
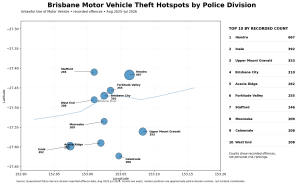
Current division counts were highest in Hendra (667), Inala (392), Upper Mount Gravatt (353), Brisbane City (310) and Acacia Ridge (262). Hendra’s position should not be interpreted simply as residential household risk: the area includes major transport, employment and airport-related land uses, creating a different vehicle-exposure environment from a conventional suburban division.
Theft from vehicles remains even more common than theft of the vehicle itself. Brisbane City recorded 7,953 offences in the “Vehicles — steal from/enter with intent” category in the latest period.
Highest property-crime locations in Brisbane City
| QPS police division | Property offences | QPS rate per 100,000 |
|---|---|---|
| Brisbane City | 8,815 | 15,320.3 |
| Hendra | 5,745 | 5,731.5 |
| Upper Mount Gravatt | 5,587 | 5,824.3 |
| Fortitude Valley | 4,937 | 9,764.8 |
| Boondall | 4,537 | 8,834.5 |
| Inala | 4,249 | 5,024.2 |
| Indooroopilly | 3,379 | 2,988.9 |
| West End | 3,169 | 7,741.8 |
| Dutton Park | 3,013 | 8,781.9 |
| Stafford | 2,913 | 4,593.7 |
Source: QPS division reported-offence number and rate files, August 2025–July 2026.
Brisbane City, Fortitude Valley and West End illustrate an important statistical problem: resident-population rates can exaggerate apparent personal risk in high-activity centres. Workers, university students, nightlife visitors, hotel guests, commuters and shoppers can generate or be exposed to offences even though they are not counted as local residents.
The same problem affects shopping-centre divisions. Shop theft is linked more closely to the number of stores, transactions and visitors than to the number of residents who sleep nearby. A high raw offence count can therefore measure economic activity as well as crime concentration.
North, South, East/Bayside, West and Inner Brisbane
QPS’s official Brisbane Region is divided into North Brisbane and South Brisbane districts and several patrol groups. To answer the more familiar geographic question “north versus south versus east versus west”, Security Wholesalers grouped the current Brisbane City police divisions into five non-overlapping editorial zones. These are not official QPS sectors and are used only to make broad comparisons easier to understand. QPS’s current Brisbane Region structure can be viewed on its official regional page. Source: QPS Brisbane Region.
| Editorial zone | Residential entry rate | Vehicle theft rate | Theft-from-vehicle rate | Property-damage rate | Shop-theft rate |
|---|---|---|---|---|---|
| Inner Brisbane | 442.1 | 507.9 | 676.2 | 1,044.6 | 2,665.1 |
| Brisbane North | 311.2 | 269.3 | 501.7 | 518.1 | 1,545.9 |
| Brisbane South | 521.4 | 442.1 | 690.6 | 478.2 | 937.2 |
| Brisbane East / Bayside | 338.4 | 384.8 | 614.3 | 519.1 | 664.5 |
| Brisbane West | 269.6 | 236.1 | 436.6 | 375.8 | 808.1 |
Rates are approximate group aggregates per 100,000 residents, reconstructed from QPS division count/rate denominators.
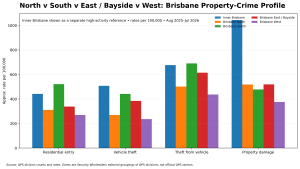
The broad pattern is revealing. South Brisbane has the highest residential-entry rate among the four suburban zones, while East/Bayside and South both have relatively high theft-from-vehicle rates. West Brisbane is lower across most selected property categories. Inner Brisbane is in a class of its own for shop theft and total property crime, but that partly reflects its very large non-resident user population.
Which Brisbane areas are deteriorating fastest?
The table below ranks current Brisbane City police divisions by the percentage change in total QPS Offences Against Property between the latest two 12-month periods. Percentage change can be volatile in small areas, so the table also shows current volume and the five-year direction.
| Police division | Previous 12m | Latest 12m | 1-year change | 5-year change | Largest latest-year driver | Driver change |
|---|---|---|---|---|---|---|
| Annerley | 1,454 | 1,689 | +16.2% | +17.0% | Unlawful Entry | +61 |
| Sandgate | 1,340 | 1,545 | +15.3% | +54.5% | Shop Stealing | +49 |
| Mount Ommaney | 2,342 | 2,668 | +13.9% | +39.7% | Shop Stealing | +299 |
| Calamvale | 1,444 | 1,636 | +13.3% | +21.6% | Unlawful Use of Motor Vehicle | +50 |
| Brisbane City | 7,811 | 8,815 | +12.9% | +33.3% | Shop Stealing | +888 |
| The Gap | 804 | 883 | +9.8% | +25.4% | Shop Stealing | +25 |
| Inala | 3,981 | 4,249 | +6.7% | +51.0% | Shop Stealing | +138 |
| Ferny Grove | 1,860 | 1,959 | +5.3% | +17.2% | Shop Stealing | +150 |
| Fortitude Valley | 4,731 | 4,937 | +4.4% | +22.3% | Shop Stealing | +115 |
| Indooroopilly | 3,256 | 3,379 | +3.8% | +24.1% | Vehicles (steal from/enter with intent) | +33 |
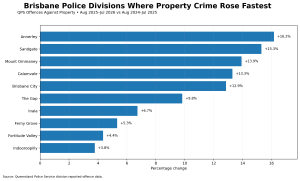
Several increases have very different explanations. In Brisbane City, shop stealing contributed an additional 888 offences compared with the previous year. Shop theft was also the largest selected contributor in Mount Ommaney, Sandgate, Inala, Ferny Grove and Fortitude Valley. In Annerley, by contrast, unlawful entry was the biggest selected contributor to the latest increase.
That distinction is exactly why a single raw property-crime number can be misleading. A retail-driven rise near a shopping centre does not imply the same household-security issue as a rise dominated by residential entry or motor vehicle theft.
Which areas are improving fastest?
| Police division | Previous 12m | Latest 12m | 1-year change | 5-year change | Largest latest-year driver | Driver change |
|---|---|---|---|---|---|---|
| Holland Park | 2,201 | 1,837 | -16.5% | +25.0% | Unlawful Entry | -162 |
| Coorparoo | 1,803 | 1,508 | -16.4% | +36.5% | Unlawful Entry | -101 |
| Carseldine | 1,257 | 1,123 | -10.7% | +4.9% | Vehicles (steal from/enter with intent) | -36 |
| Moorooka | 2,036 | 1,861 | -8.6% | +21.0% | Unlawful Entry | -82 |
| Morningside | 2,666 | 2,470 | -7.4% | +17.3% | Unlawful Entry | -142 |
| Stafford | 3,130 | 2,913 | -6.9% | +16.2% | Unlawful Entry | -128 |
| Carina | 1,874 | 1,750 | -6.6% | +27.9% | Unlawful Entry | -83 |
| Sherwood | 1,164 | 1,096 | -5.8% | +22.0% | Unlawful Entry | -78 |
| Dutton Park | 3,185 | 3,013 | -5.4% | +28.2% | Unlawful Entry | -91 |
| Wynnum | 2,630 | 2,538 | -3.5% | +42.0% | Unlawful Entry | -65 |
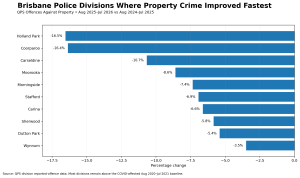
Holland Park and Coorparoo recorded the largest latest-year percentage falls among the Brisbane City divisions analysed. In both cases unlawful entry was the biggest selected contributor to the decline. Similar reductions in unlawful entry were important in Moorooka, Morningside, Stafford, Carina, Sherwood and Dutton Park.
Only Carseldine among the ten fastest-improving divisions is currently below its equivalent 2016 total property-offence count. That is another reason to distinguish “improving now” from “low crime” or “improved over a decade”.
Brisbane City versus Logan, Moreton Bay, Redlands and Ipswich
Greater Brisbane is much larger than Brisbane City Council. The adjoining metropolitan LGAs are shown separately below. Each cell for the three selected crimes shows count / QPS rate per 100,000.
| LGA | Property offences | Property rate /100k | Residential entry count / rate | Vehicle theft count / rate | Theft from vehicle count / rate |
|---|---|---|---|---|---|
| Brisbane | 73,150 | 5,270.6 | 5,100 / 367.5 | 4,955 / 357.1 | 7,953 / 573.0 |
| Logan | 26,683 | 6,497.9 | 1,843 / 449.4 | 2,145 / 522.7 | 3,762 / 915.9 |
| Moreton Bay | 20,118 | 3,732.8 | 996 / 184.9 | 985 / 182.9 | 2,080 / 386.0 |
| Redland | 4,695 | 2,690.4 | 261 / 149.6 | 289 / 165.6 | 532 / 305.1 |
| Ipswich | 13,125 | 4,796.9 | 686 / 250.5 | 891 / 325.4 | 1,630 / 595.4 |
Source: QPS LGA reported-offence number and rate files, August 2025–July 2026.
Logan stands out in the current comparison. Its property-offence rate of approximately 6,497.9 per 100,000 is higher than Brisbane City’s 5,270.6, and its motor-vehicle-theft rate is approximately 522.7 per 100,000 compared with Brisbane City’s 357.1. Logan’s vehicle theft count also increased strongly in the latest year.
Moreton Bay and Redland have lower current population-adjusted property-crime rates than Brisbane City, although both contain individual activity centres and local hotspots that can differ materially from their LGA averages. Ipswich’s current overall property rate sits below Brisbane City’s, while its theft-from-vehicle rate is slightly higher.
What gets stolen in Brisbane?
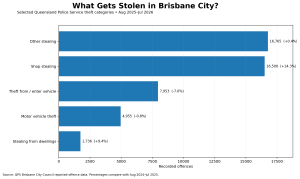
Shop stealing and the broad “other stealing” category account for the largest selected theft totals. Vehicle-related crime remains the household-relevant standout: 7,953 theft-from/vehicle-entry offences plus 4,955 motor vehicle thefts were recorded in the latest year.
Stealing from dwellings increased 9.4% to 1,736 offences even while the broader residential unlawful-entry category fell. That illustrates another important point: entry offences and the eventual theft of property are related, but they are not identical QPS measures.
Why shopping centres, nightlife precincts and transport hubs can look extreme
Crime rankings become unreliable when the denominator does not match the activity generating the crime.
A large shopping centre may record thousands of retail theft incidents while having relatively few permanent residents immediately around it. A nightlife precinct can have a resident population of tens of thousands but receive far more patrons across a year. Transport hubs and airport precincts contain large numbers of parked vehicles and transient users.
This is why Brisbane City, Fortitude Valley, Upper Mount Gravatt, Boondall, Indooroopilly, Hendra and similar high-activity divisions should not be interpreted with a simple “offences divided by residents equals personal risk” formula.
The QPS Online Crime Map is useful for examining the exact spatial distribution within these locations because it allows searches by suburb, postcode, offence type and date over the most recent five years. Source: QPS Online Crime Map.
What the data means for Brisbane houses, apartments and businesses
Detached houses
Brisbane’s detached housing pattern makes side access, rear yards, garages, carports and driveways important parts of the security picture. QPS’s July 2026 Safer Together material specifically advises residents to secure garages, side gates and rear access points, keep vehicle keys out of sight, and avoid leaving vehicles unlocked in driveways. It also notes that offenders may enter homes specifically to obtain car keys. Source: QPS Safer Together home-burglary guidance.
The data supports treating the home and vehicle as one security system. Residential entry is currently falling, but motor vehicle theft remains more than double its comparable 2016 volume.
Garages and driveways
QPS recommends using off-street parking where available and, where possible, parking behind locked gates or in a locked garage. Vehicle doors and windows should still be secured inside the garage, and keys and garage remotes should not be left where an intruder can easily access them. Source: QPS vehicle and bike security.
Apartments and townhouses
For multi-residential properties, the individual front door is only one security layer. QPS highlights communal entrances, parking areas, storage areas, intercom access and the importance of ensuring garage doors close fully. That is particularly relevant in inner Brisbane, where theft-from-vehicle rates are high and many cars are parked in shared facilities. Source: QPS home and multi-residential security.
Retail businesses
Shop stealing is the fastest-rising major property category in the latest Brisbane City snapshot, up 14.3%. Retailers therefore face a different risk profile from households. QPS business-security guidance recommends identifying the offences most relevant to the business and treating the specific security layers that address them rather than applying the same controls everywhere. Source: QPS business security.
Warehouses and trade premises
For warehouses, workshops and trade premises, the most useful local indicators are non-residential unlawful entry, vehicle theft, theft from vehicles and property damage. Perimeter gates, loading areas, fleet vehicles, tool storage and after-hours access are therefore more relevant than a suburb-wide residential break-in ranking.
Methodology and limitations
This analysis uses official Queensland Police Service reported offences. It does not create a proprietary “danger score”. The QPS public files provide monthly offence counts and rates per 100,000 people for Queensland, police regions, districts, divisions and LGAs. QPS itself recommends comparing longer time periods rather than isolated months because crime is seasonal. Source: QPS Maps and Statistics.
The principal current period is August 2025–July 2026. One-year comparisons use August 2024–July 2025; five-year comparisons use August 2020–July 2021; ten-year comparisons use August 2015–July 2016.
Brisbane City means Brisbane City Council. Logan, Moreton Bay, Redland and Ipswich are not added into Brisbane City totals.
For intra-Brisbane analysis, police divisions are used because QPS’s downloadable division series provides a reproducible long-run time series. Police divisions are not the same thing as suburbs and can include multiple neighbourhoods or major non-residential land uses.
The maps in this article show the top police divisions using approximate division-centre markers. They are visual guides, not official boundary maps or street-level incident maps. Exact current incident geography should be checked in the official QPS Online Crime Map.
The North/South/East-Bayside/West/Inner comparison is an editorial grouping of 25 Brisbane City police divisions created for this article. It does not replace QPS’s official district and patrol-group boundaries. Approximate zone rates were reconstructed from the QPS count and division-rate denominators.
Population-adjusted rates are useful when comparing ordinary residential areas of different sizes, but they remain imperfect in CBDs, shopping centres, airports, university precincts, nightlife districts and transport hubs because the true user population can be far larger than the resident population.
Finally, recorded offences measure offences known to police. Changes may reflect actual offending, reporting behaviour, policing activity, classification practices and boundary changes. Five-year comparisons are especially affected by COVID-era mobility restrictions.
The bottom line
The most important Brisbane crime statistic in 2026 is not a single suburb ranking.
Residential break-in is moving down, but motor vehicle theft remains structurally much higher than a decade ago. Theft from vehicles remains a large-volume problem. Shop theft is rising strongly. And the areas that appear highest in raw crime tables are often major retail, nightlife, transport or employment centres rather than ordinary residential suburbs.
For Brisbane households, the data points toward a practical security model that covers the whole property: doors and windows, side gates and rear access, garages, driveways, vehicles and keys. For businesses, the right controls depend on whether the dominant local issue is shop theft, after-hours entry, vehicle crime or property damage.
The best use of crime statistics is therefore not to label an area “safe” or “dangerous”. It is to identify which offence is actually changing, where it is concentrated, and what physical exposure creates the opportunity.