


2026 Australia Crime Statistics: Which Cities and States Are Safest? Leave a comment
Australia remains a relatively safe country by global standards, but the latest official crime data shows a more complicated local picture. Household crime has fallen over the long term in several categories, but vehicle theft, retail theft, attempted break-ins and some violent offences remain major concerns in specific states, suburbs and city centres.
The most important takeaway is this: there is no single “safest city” in Australia unless you first define what type of crime you care about. A retiree worried about home burglary, a parent worried about youth crime, a business owner worried about retail theft, and an apartment resident worried about storage cage break-ins are all looking at different risks.
Based on official Australian Bureau of Statistics, state police and crime agency data, the broad safety pattern looks like this:
- South Australia and New South Wales show comparatively lower household break-in rates in the latest ABS state-level victimisation data.
- Canberra is still described by ACT Policing as one of Australia’s safest cities, but aggravated burglaries and vehicle theft linked to youth offending became a major operational focus in 2024–25.
- Victoria has seen a clear rise in recorded offences, with theft from motor vehicles and property/deception offences driving much of the increase.
- Queensland’s most recent police snapshot shows improvement in unlawful entry, robbery and unlawful use of motor vehicles, but attempted break-ins remain high in ABS household victimisation data.
- Western Australia has improved significantly over the decade on household crime, but still records relatively high theft-from-vehicle and malicious property damage rates.
- The Northern Territory remains the highest-risk jurisdiction for several household and personal crime measures, especially break-ins, attempted break-ins, malicious property damage and assault.
For households and businesses, the practical conclusion is not panic. It is targeted prevention. The most useful security decisions are based on local crime type: cameras for evidence and deterrence, alarms for intrusion response, lighting for opportunistic theft, intercoms/access control for apartment and business entry points, and proper locks/sensor coverage for homes where vehicles are parked outside.
Why crime statistics can be misleading
Crime articles often rank cities from safest to most dangerous, but those rankings can be unreliable if they mix different data sources or compare different offence categories.
For example, one state may publish “criminal incidents”, another may publish “victims”, another may publish “offences”, and another may provide suburb-level crime data with different privacy rules. A fair comparison needs to separate:
- Victimisation data — survey-based estimates of people or households who experienced crime.
- Police-recorded data — crimes reported to or detected by police.
- Offence counts — individual offences, which may include multiple offences in one event.
- Incident counts — events recorded by police, which may contain multiple offence types.
- Rates per 100,000 people or households — the best way to compare areas with different population sizes.
For home and business security, the most useful categories are usually break-ins, attempted break-ins, theft from motor vehicles, motor vehicle theft, malicious property damage, robbery, assault, retail theft and theft from dwellings.
The national crime picture in 2024–25
The latest ABS Crime Victimisation survey estimates that 8.5% of Australian households experienced at least one selected household crime in 2024–25.
The most common selected household crime was malicious property damage, affecting 3.4% of households. Theft from a motor vehicle affected 2.2% of households, attempted break-in affected 2.0%, break-in affected 1.8%, other theft affected 1.7%, and motor vehicle theft affected 0.6%.
This means that burglary is not the only concern. For many households, the bigger everyday risks are damage to property, theft from cars and opportunistic attempts to enter homes, garages, sheds and apartment storage areas.
The long-term trend is mixed. Compared with 2014–15, break-ins, theft from motor vehicles, malicious property damage and other theft are all lower nationally. However, the recent picture is not evenly improving. Some states have seen pressure from vehicle theft, retail theft, aggravated burglary, youth offending and family violence-related incidents.
Chart 1 — National household crime snapshot, 2024–25
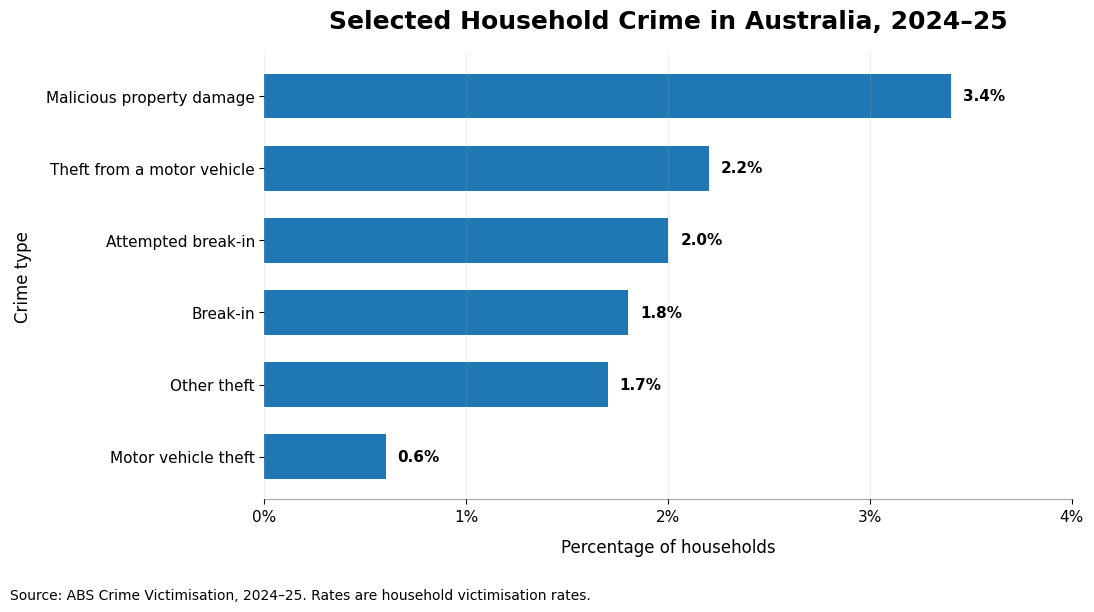
Chart 2 — 10-year household crime trend
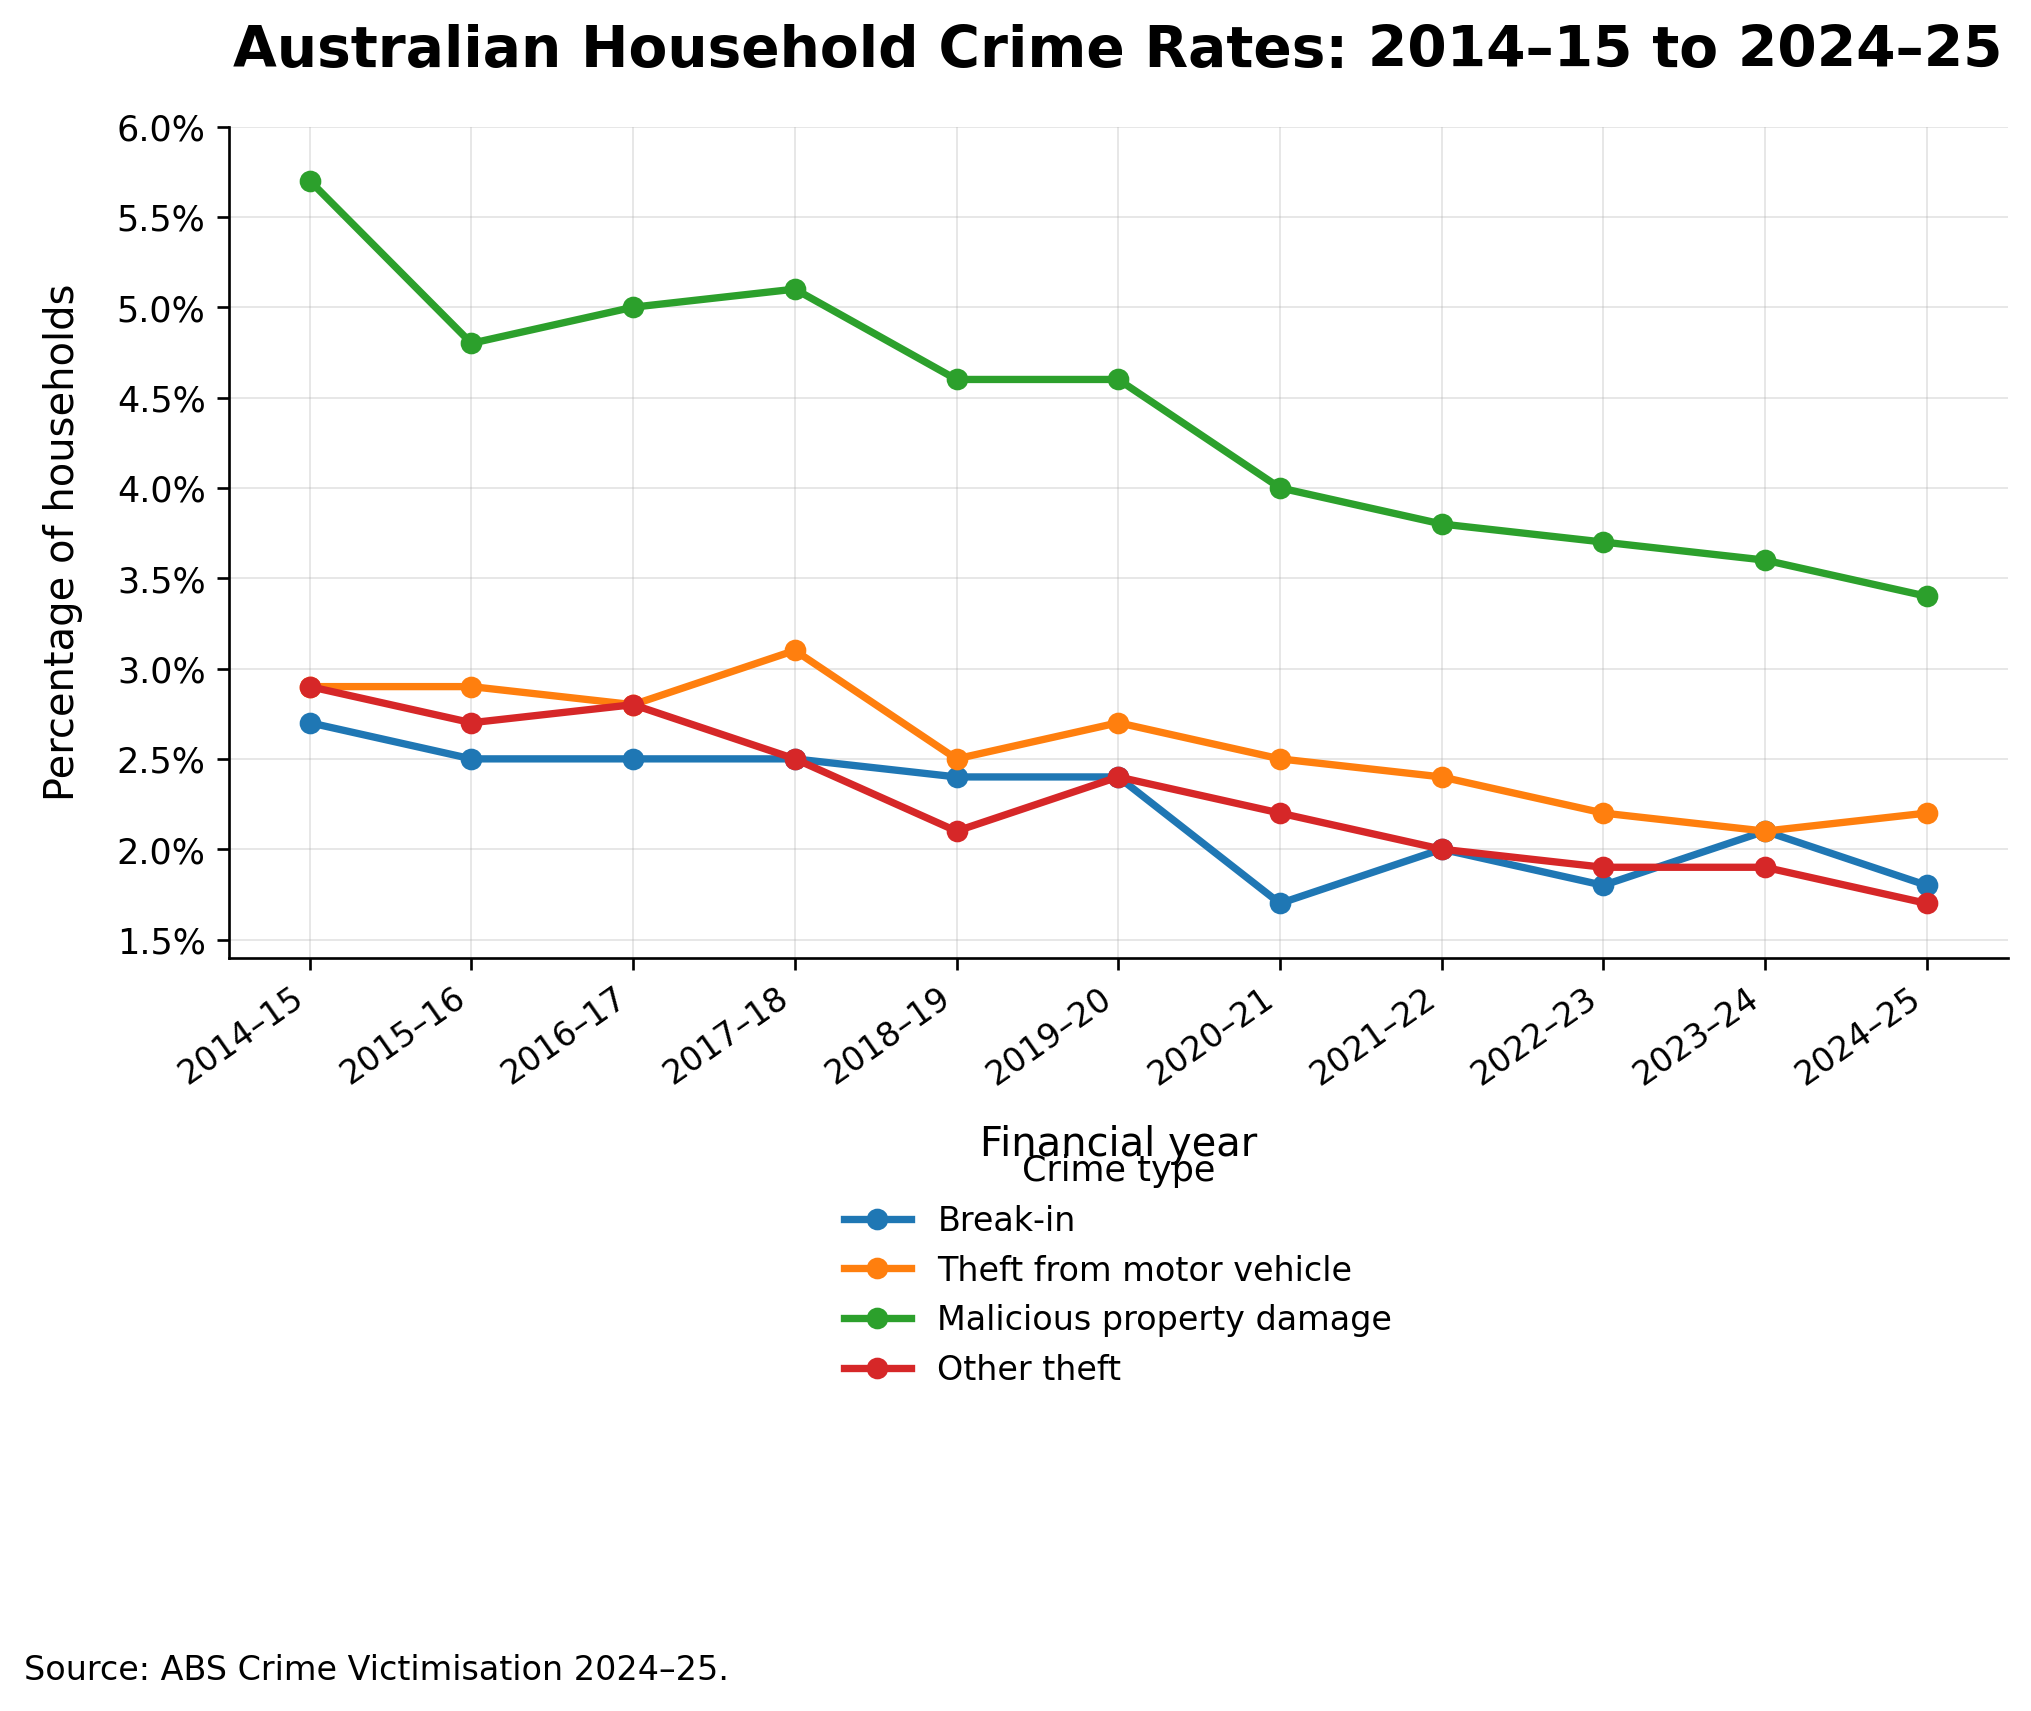
Chart 3 — State comparison: break-in risk
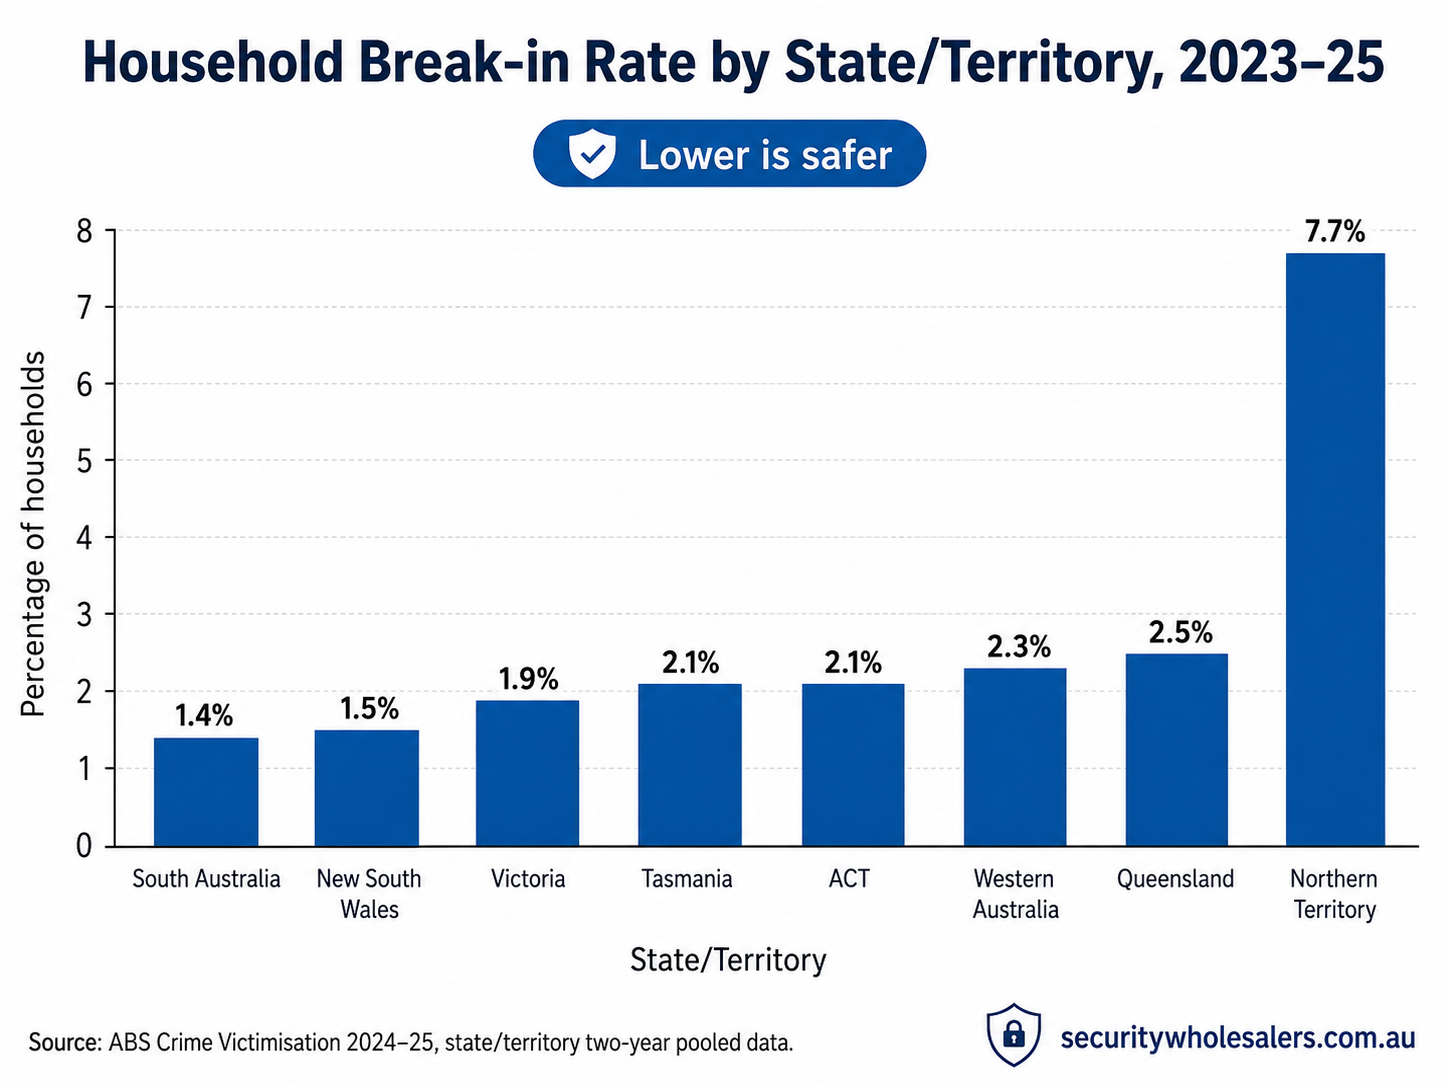
Chart 4 — State comparison: theft from motor vehicles
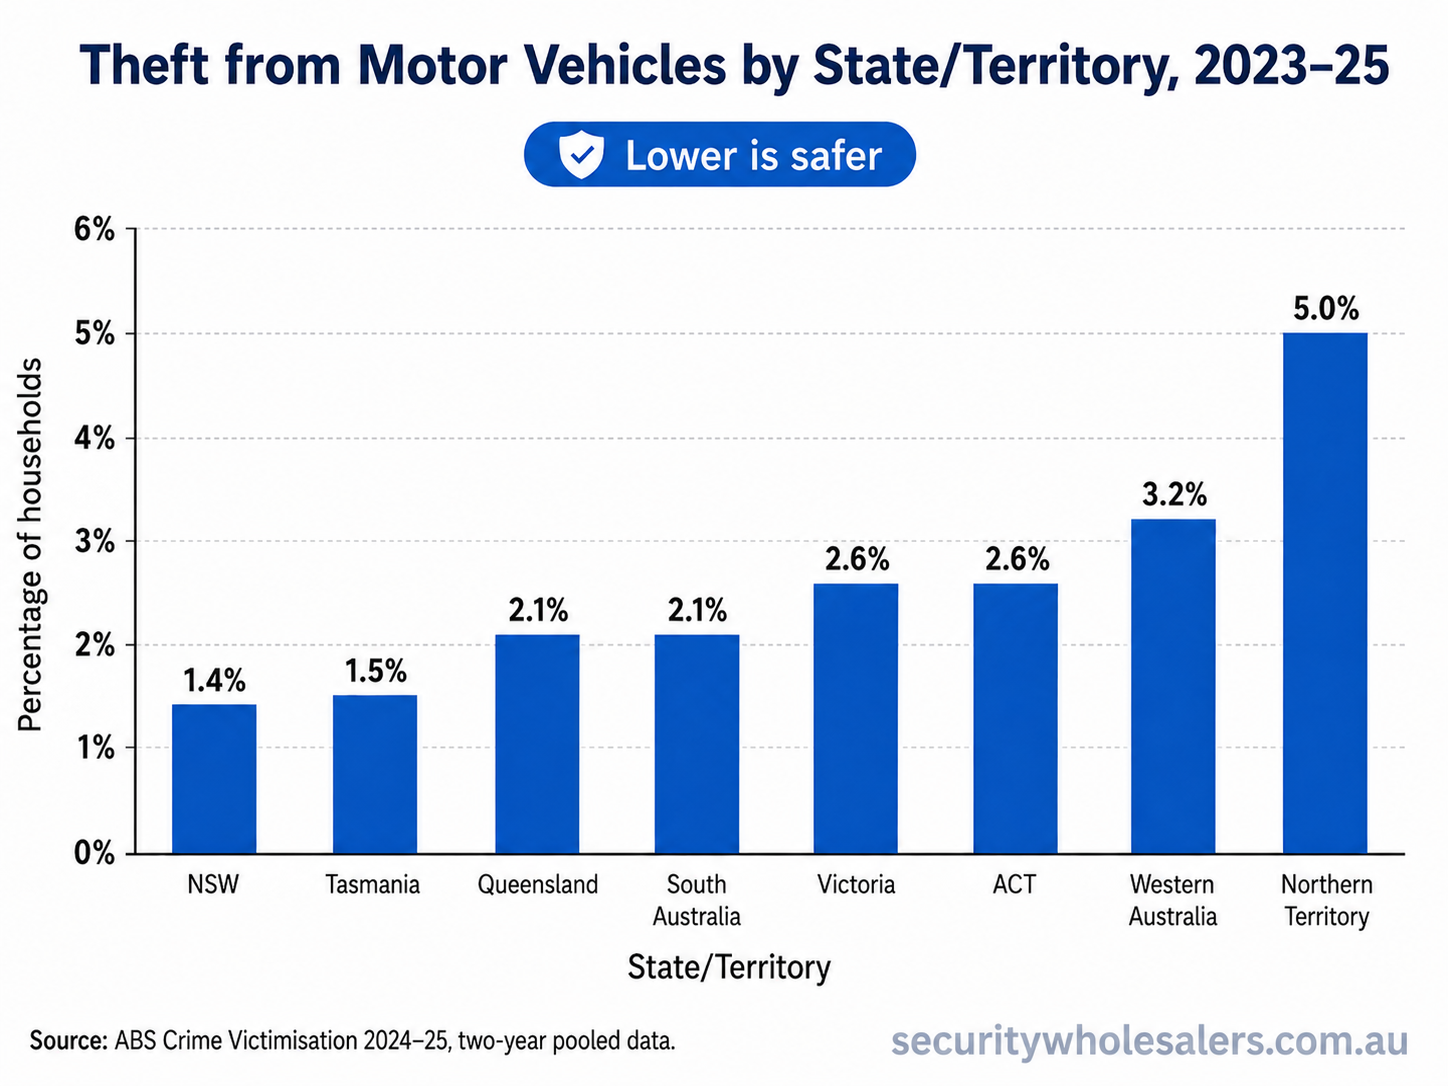
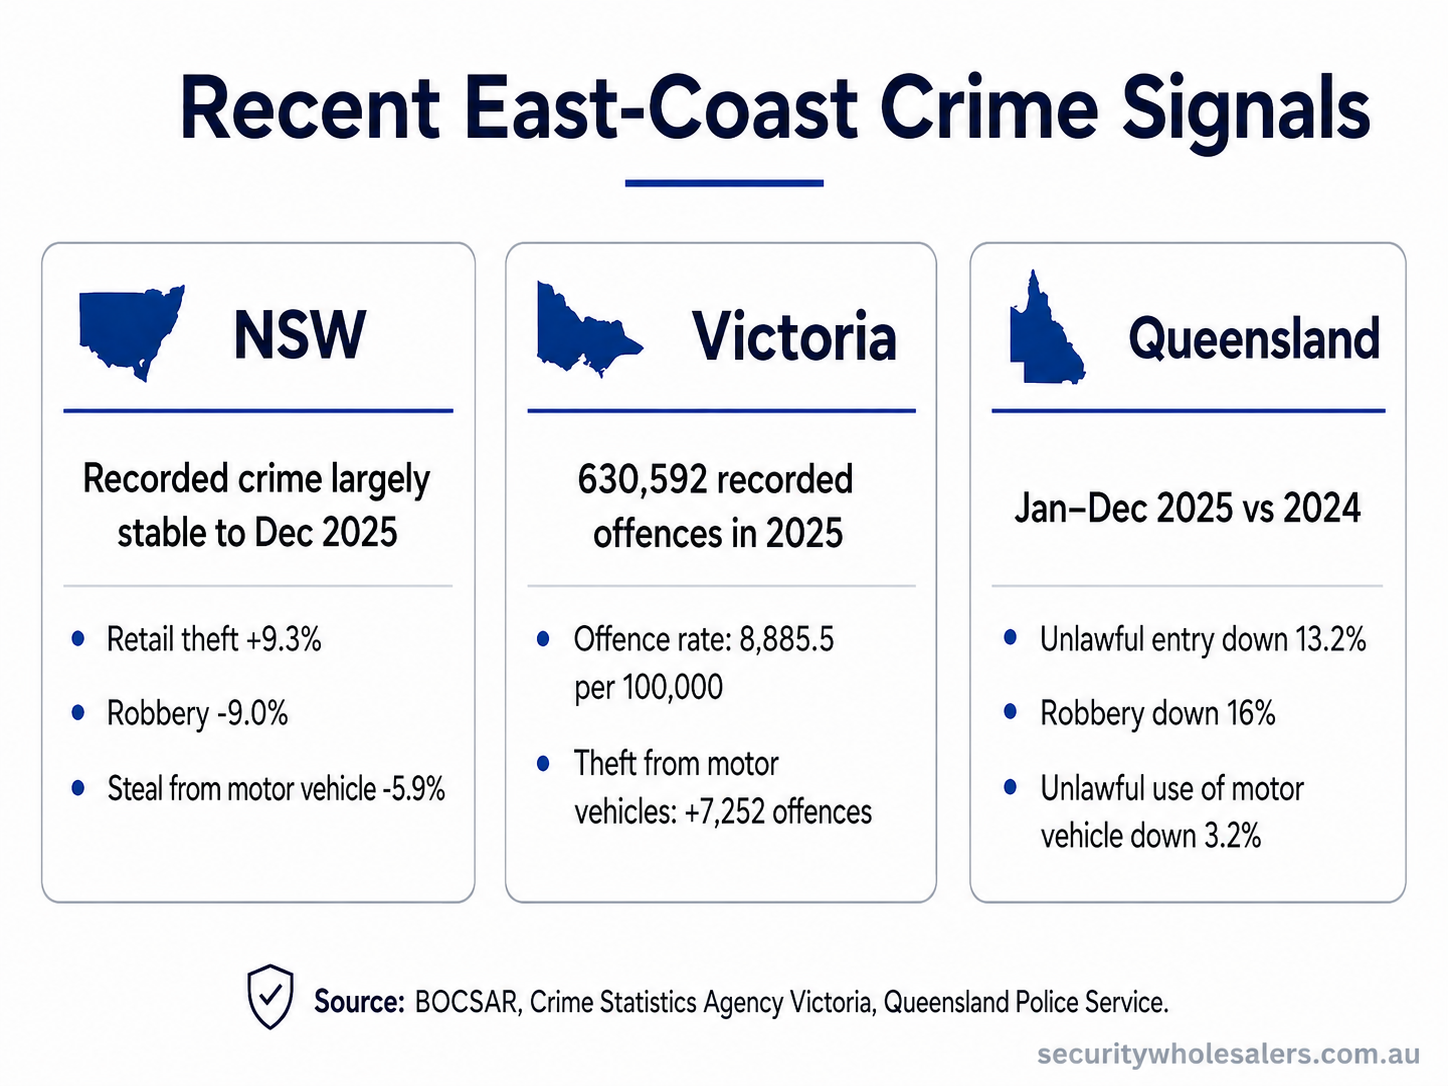
Chart 5 — Recent east-coast crime movement cards
Police-recorded crime: theft is the volume driver
Police-recorded national data shows that theft dominates the volume of recorded crime. In 2024, “other theft” reached 595,660 victims, the highest recorded number since 2003. Nearly half of other theft occurred in retail locations, which helps explain why shoplifting and organised retail theft have become major concerns for businesses.
Motor vehicle theft also rose nationally in 2024, with 65,603 victims recorded by police. The rise was not evenly spread across the country. Victoria recorded a particularly sharp increase, while New South Wales also increased.
For homeowners, the vehicle theft trend matters because modern burglaries are often connected to car theft. Offenders may enter a house, garage or apartment complex not to steal large household items, but to find car keys, fobs, wallets, remotes or access cards.
Which Australian cities and states look safest?
A simple “safest city” ranking can be misleading, so the better question is: safest for what?
Best signals for household safety
Using the latest ABS two-year pooled state and territory household victimisation data, South Australia and New South Wales show relatively favourable results for break-ins. South Australia recorded a 1.4% household break-in rate in 2023–25, while New South Wales recorded 1.5%. Victoria followed at 1.9%.
Queensland recorded a higher 2.5% break-in rate and a notably high attempted break-in rate of 3.6%. Western Australia recorded 2.3% for break-ins and 3.2% for theft from motor vehicles. The ACT recorded 2.1% for break-ins and 2.6% for theft from motor vehicles, while Tasmania recorded 2.1% for break-ins. The Northern Territory was much higher, with a 7.7% break-in rate and 8.8% attempted break-in rate.
On household property crime alone, Adelaide and many South Australian suburbs look comparatively favourable. Sydney also performs better than many people might expect for break-in risk, although this varies heavily by suburb and dwelling type.
Canberra: safe overall, but vehicle-related burglary pressure
ACT Policing continues to describe Canberra as one of Australia’s safest cities. However, its 2024–25 annual reporting also notes a sharp escalation in aggravated burglaries and motor vehicle thefts that led to Operation Minlaton. This is a good example of why “safe city” labels still need local interpretation. A city may be safe overall while still having a serious issue in specific suburbs, streets or crime categories.
Sydney: stable overall, but retail theft and sexual assault reports are rising
New South Wales recorded largely stable crime over the two years to December 2025. BOCSAR reported increases in sexual assault and steal-from-retail-store, while robbery, break and enter non-dwelling and steal-from-motor-vehicle declined. Greater Sydney had only one major offence category in decline: steal from motor vehicle. Retail theft increased in Greater Sydney.
For Sydney households, the overall message is mixed but not alarming. Many residential property crime categories are stable or lower than a decade ago, but retail areas, transport corridors, apartment storage areas and dense mixed-use precincts remain higher-risk.
Melbourne: property and vehicle theft pressure
Victoria is the state with the clearest recent deterioration in recorded offence data. In the year to December 2025, Victoria recorded 630,592 offences, with the offence rate rising to 8,885.5 per 100,000 people. Property and deception offences were the largest driver, and theft from motor vehicles was a major contributor.
For Melbourne households and businesses, this makes vehicle security, garage security, apartment entry control and CCTV coverage particularly important. The concern is not just a traditional “someone broke into the house” scenario. It is also theft from driveways, car parks, shared garages, retail spaces and storage cages.
Brisbane and Queensland: improving recent police indicators, but attempted break-ins remain high
Queensland Police reported that unlawful entry, robbery and unlawful use of motor vehicles fell in 2025 compared with 2024. That is a positive signal. However, ABS household victimisation data still shows Queensland with a higher attempted break-in rate than most states.
For Queensland homes, especially detached houses, townhouses and properties with side access, good perimeter security matters. Side gates, garage doors, sheds, car keys and unlit areas around the home are common weak points.
Perth and Western Australia: improved over the decade, but still watch vehicle-related crime
Western Australia has improved substantially over the decade across several household crime measures. ABS data shows break-in, attempted break-in, motor vehicle theft, theft from motor vehicles, malicious property damage and other theft all lower in 2023–25 than in 2013–15.
However, WA still records higher theft-from-motor-vehicle and malicious-property-damage rates than NSW, SA and Victoria in the ABS household data. For Perth homes and businesses, CCTV around driveways, car parks and external access points can be more important than just monitoring the front door.
Darwin and the Northern Territory: highest-risk jurisdiction
The Northern Territory stands out in the data. ABS estimates show much higher rates of break-in, attempted break-in, motor vehicle theft, theft from motor vehicles and malicious property damage than other jurisdictions. The NT also records a high rate of physical and/or threatened assault.
This does not mean every street or suburb is unsafe. But it does mean homes and businesses in higher-risk NT areas should treat physical security as essential infrastructure, not an optional upgrade.
The safest areas are usually not CBDs
CBDs often look “unsafe” in raw crime rankings because they have high visitor numbers, nightlife, retail density, transport hubs and commercial activity. A small resident population can also distort per-capita crime rates. For example, a city centre may record many offences because hundreds of thousands of workers, shoppers and visitors pass through it, even though only a smaller number of people live there.
That is why residential safety should be assessed at suburb, postcode, LGA or police district level, not by city name alone.
Generally, lower-risk residential areas tend to have:
- lower transient foot traffic
- fewer late-night entertainment venues
- more owner-occupier housing
- stronger informal neighbour surveillance
- better lighting and street visibility
- fewer unsecured shared car parks and storage cages
- less direct access to rear lanes, parks and transport corridors
Higher-risk areas tend to include CBDs, retail strips, public transport hubs, large shopping precincts, industrial zones, high-density apartment areas with shared access, and suburbs with high levels of vehicle theft or repeat youth offending.
What this means for home security
The crime data supports a layered approach to security.
1. Protect the vehicle and the keys
Vehicle theft and theft from vehicles are now central risks. Do not leave keys near the front door, kitchen bench or hallway table. Many modern burglaries are quick entries designed to locate keys and leave within minutes.
Useful security measures include:
- cameras covering driveway and front approach
- sensor lights near vehicles and side paths
- garage reed switches or door sensors
- alarm sensors for entry points
- smart notifications when someone enters the driveway
- secure key storage away from visible entry points
2. Secure the side and rear of the home
Many homes spend money on a video doorbell but leave side gates, garages, laundries and rear sliding doors weak. A good system should cover the paths offenders actually use.
Priorities include:
- side gate locks
- rear door sensors
- garage door contacts
- cameras covering side access
- lighting along the side path
- a camera covering the rear yard or shed
3. Apartment buildings need access control, not just cameras
In apartment complexes, many issues occur in shared areas: car parks, lobbies, mail rooms, storage cages and lift areas. CCTV helps, but access control is often more important.
Useful measures include:
- fob-controlled entry
- intercom audit trails
- cameras at entry and exit points
- cameras covering mailboxes and storage cages
- secure visitor access processes
- regular removal of inactive fobs
4. Businesses should focus on retail theft and after-hours entry
Retail theft is a major driver of theft statistics. For shops, warehouses and showrooms, the best setup is not just a camera pointed at the counter.
Better coverage includes:
- entry camera at face height
- camera over POS area
- aisle or stock coverage
- rear door sensor
- alarm with opening/closing reports
- external camera for after-hours entry attempts
- clear signage that CCTV and alarms are active
5. Use cameras for identification, not just “general view”
A common mistake is installing a wide-angle camera too high. It may show that someone was on the property, but not capture a useful face, plate or clothing detail.
For evidence, cameras should be positioned to capture:
- faces at entry points
- vehicles entering driveways
- number plates where practical
- hands at doors, gates and storage cages
- approach paths before the person reaches the door
Final verdict: where is safest?
If we focus on household property crime, South Australia and New South Wales currently show some of the strongest state-level signals. Canberra remains one of Australia’s safest capital cities overall, although recent vehicle-related burglary issues show that even safe cities can have targeted crime patterns.
If we focus on recent deterioration, Victoria deserves the most attention because recorded offences, property/deception offences and theft from motor vehicles have risen sharply. Queensland has shown recent improvement in police-recorded unlawful entry, robbery and vehicle use offences, but attempted break-ins remain a concern in household survey data. Western Australia has improved significantly over the decade, but still has higher rates for some property damage and vehicle-related household crimes. The Northern Territory remains the highest-risk jurisdiction on multiple measures.
The best conclusion for homeowners and businesses is not to choose security based on national averages. Choose it based on your suburb, your property type and the most likely crime in your area.
For a house, that usually means doors, windows, garage, driveway and side access. For apartments, it means entry control, storage cages, mail rooms and car parks. For businesses, it means retail theft, staff safety, after-hours entry and evidence-quality camera placement.
Crime has not disappeared. It has become more targeted, faster and more opportunistic. A well-designed security system should do the same: detect early, record clearly and make your property a harder target than the one next door.
Methodology: how we compared Australian crime data
This article uses official Australian crime data from the Australian Bureau of Statistics, state crime agencies and police reporting dashboards. The main national source is the ABS Crime Victimisation survey, which estimates the percentage of people or households that experienced selected crimes. This is different from police-recorded crime, which only includes incidents reported to or detected by police.
For that reason, this article does not treat any single number as a perfect “safety score”. Instead, we separate household victimisation rates, police-recorded offences, vehicle-related crime, retail theft, and longer-term trends. This gives a more useful picture for homeowners, renters, apartment residents and business owners deciding what type of security risk matters most.
Important note: “Safest city” rankings can be misleading. A CBD with a small resident population but very high visitor numbers may look worse in raw crime counts than a quiet residential suburb. For home security decisions, suburb-level data, property type and the most common local offence type are usually more useful than a simple capital-city ranking.
Key Australian crime statistics at a glance
| Crime category | Latest key figure | What it means for security |
|---|---|---|
| Households experiencing at least one selected household crime | 8.5% of Australian households in 2024–25 | Property crime is still common enough that prevention matters, especially for homes with cars, garages, sheds and side access. |
| Break-in | 1.8% of households in 2024–25 | Door, window, garage and rear-entry protection should be prioritised over only watching the front door. |
| Attempted break-in | 2.0% of households in 2024–25 | Visible cameras, lighting, alarms and strong locks can help stop an attempt before entry is made. |
| Theft from motor vehicles | 2.2% of households in 2024–25 | Driveway cameras, garage sensors and not leaving valuables in cars remain important. |
| Malicious property damage | 3.4% of households in 2024–25 | External cameras, lighting and visible deterrents can help with vandalism and damage claims. |
| Police-recorded “other theft” | 595,660 victims in 2024 | Retailers should treat shop theft as a major security issue, not a minor loss-prevention problem. |
What the latest data means for Australian homes and businesses
The latest figures show that Australian property crime is not just about classic burglary. A modern home or business security plan should also consider attempted entry, theft from vehicles, vandalism, garage access, shared apartment entries, retail theft and after-hours access.
For homes, this means the most important areas are often the driveway, garage, front approach, side path, rear sliding door and any shed or detached storage area. For apartments, the weak points are usually the lobby, basement car park, mailbox area, storage cages and shared doors. For businesses, the priority is usually entry points, point-of-sale areas, high-value stock zones, rear doors and after-hours access.
A good CCTV or alarm system should not just record that “someone was there”. It should capture useful evidence: faces at entry points, vehicles in driveways or loading areas, number plates where practical, and activity near doors, gates, counters and storage areas.
Practical security checklist based on the crime data
| Risk | Best prevention measures | Useful products or system features |
|---|---|---|
| Break-ins and attempted break-ins | Secure doors, windows, garages, side gates and rear access points | Alarm sensors, reed switches, sirens, perimeter cameras, smart alerts |
| Theft from vehicles | Improve driveway and garage coverage, remove valuables from sight, keep keys away from entry points | Driveway CCTV, garage door sensors, motion alerts, external lighting |
| Retail theft | Record clear face-level footage at entry and POS areas | Entry cameras, POS cameras, aisle cameras, signage, alarm reporting |
| Apartment theft and storage cage break-ins | Control access to shared areas and record entry/exit points | Intercoms, access control, car park CCTV, lobby cameras |
| Vandalism and malicious damage | Increase visibility and record activity around exterior walls, doors, fences and vehicles | External turret cameras, sensor lights, AI human detection, siren/strobe cameras |
FAQ: Australian crime statistics and security
Which Australian state is safest for break-ins?
Using the latest ABS two-year pooled household victimisation data, South Australia and New South Wales have comparatively low break-in rates. However, this should not be interpreted as every suburb being low risk. Suburb-level data and property type still matter.
Is crime getting worse in Australia?
It depends on the offence type. Some household crime categories are lower than they were a decade ago, but police-recorded theft, retail theft, motor vehicle theft and some localised youth-crime issues remain major concerns in particular states and suburbs.
Are CBDs more dangerous than suburbs?
CBDs often record more offences because they have large visitor numbers, nightlife, shops, transport hubs and commercial activity. A CBD can look worse in raw crime figures even if many residential suburbs have higher household break-in risk.
What is the most useful security upgrade for a home?
For many homes, the best first step is a layered system: cameras covering the driveway and approach points, alarm sensors on doors and garage access, sensor lighting, and secure key storage away from the front door.
What security should a small business prioritise?
Small businesses should prioritise clear entry footage, point-of-sale coverage, after-hours alarm protection, rear-door sensors and cameras covering high-value stock or loading areas. Retail theft and after-hours entry usually require different camera angles.
References
- Australian Bureau of Statistics — Crime Victimisation, 2024–25
- Australian Bureau of Statistics — Recorded Crime: Victims, 2024
- Australian Bureau of Statistics — Crime Victimisation Methodology, 2024–25
- Australian Bureau of Statistics — Recorded Crime: Victims Methodology, 2024
- NSW Bureau of Crime Statistics and Research — Crime and Policing Statistics
- BOCSAR — NSW Recorded Crime Statistics, December 2025 Update
- Crime Statistics Agency Victoria — Key Figures, Year Ending December 2025
- Queensland Police Service — Maps and Statistics
- South Australia Police — Crime Statistics Map
- Western Australia Police Force — Crime Statistics
- ACT Policing — Annual Report 2024–25