

















Adelaide Crime Statistics 2026: Is Adelaide Really One of Australia’s Safest Capitals? Leave a comment
Adelaide is regularly described as one of Australia’s safer capital cities. But is that claim actually supported by crime data — and does it apply evenly across metropolitan Adelaide?
The answer is more nuanced than a “safest city” ranking suggests.
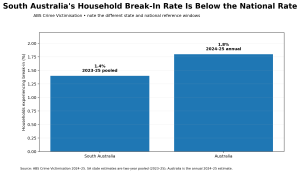
On the measure most directly relevant to household break-ins, South Australia currently performs better than the national average. The Australian Bureau of Statistics estimates that 1.4% of South Australian households experienced a break-in in the latest pooled 2023–25 state estimate. Nationally, the 2024–25 annual estimate was 1.8%. South Australia’s break-in rate has also fallen substantially from 2.3% in the 2013–15 pooled period.
But statewide household victimisation is not the same thing as suburb-level police crime. Adelaide CBD, major shopping centres, transport hubs and some northern and southern activity centres generate much larger raw offence counts because many more people use them than live there. At the same time, several suburban areas have recorded substantial recent declines, while pockets of the outer and inner north have moved in the opposite direction.
This analysis therefore tests the safety claim at three levels: ABS household victimisation, SAPOL statewide crime trends and Data SA suburb-level recorded offences.
Data periods used
The latest complete SAPOL financial-year comparison is 2024–25 versus 2023–24. The current Data SA suburb file covers 1 July 2025 to 31 March 2026 (Q1–Q3), so current suburb changes are compared only with the same nine months of 2024–25. ABS Crime Victimisation 2024–25 is the latest household survey release. Sources: SAPOL Crime Statistics, Data SA suburb crime dataset and ABS Crime Victimisation.
Greater Adelaide’s estimated resident population reached 1,491,015 at 30 June 2025, up 18,647 people or 1.3% in a year. The strongest growth was concentrated in the outer north — particularly Munno Para West–Angle Vale and Virginia–Waterloo Corner — while Mount Barker was among the largest-growing Adelaide Hills areas. Source: ABS Regional Population 2024–25.
So, is Adelaide genuinely low-risk for residential burglary?
At the state household level, the evidence supports that conclusion — with qualifications.
ABS Crime Victimisation estimates that South Australia’s household break-in victimisation rate declined from 2.3% in 2013–15 to 1.4% in 2023–25. Over the same broad decade, motor vehicle theft fell from 0.6% to 0.3%, theft from motor vehicles fell from 2.8% to 2.1%, and malicious property damage fell from 5.9% to 3.3%.
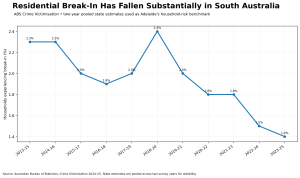
The latest South Australian break-in estimate is below the national annual rate of 1.8%. That is meaningful evidence that South Australian households experience break-in at a comparatively low rate, although the state and national reference windows are not identical.
There is another important distinction: ABS measures households that experienced victimisation, while SAPOL counts offences reported or becoming known to police. The two series answer different questions and should not be expected to match one-for-one.
What changed in South Australia in the latest complete financial year?
| SAPOL offence category | 2023–24 | 2024–25 | Change |
|---|---|---|---|
| Serious criminal trespass | 13,070 | 12,246 | -6% |
| Theft and related offences | 56,162 | 50,499 | -10% |
| Property damage and environmental | 22,379 | 21,867 | -2% |
| Robbery and related offences | 816 | 724 | -11% |
| Acts intended to cause injury | 23,632 | 24,285 | +3% |
| Total offences against property | 95,887 | 88,517 | -8% |
Source: SAPOL Annual Report 2024–25.
Property crime moved down strongly overall. SAPOL recorded 88,517 offences against property in 2024–25, down 8% from 95,887. Serious Criminal Trespass fell 6%, theft and related offences fell 10%, property damage fell 2% and robbery fell 11%. Acts intended to cause injury moved in the opposite direction, increasing 3%.
Within Serious Criminal Trespass, SAPOL says SCT–Residence fell 10%, or 553 offences. Theft from motor vehicles fell 19%, or 1,811 offences. These are statewide figures, but they reinforce the direction seen in the ABS household survey.
Vehicle theft: the long-term household picture has improved too
South Australia’s household motor vehicle theft victimisation rate is approximately half its level a decade earlier: 0.3% in 2023–25 compared with 0.6% in 2013–15. Theft from motor vehicles remains much more common, at 2.1% of households in the latest state estimate.
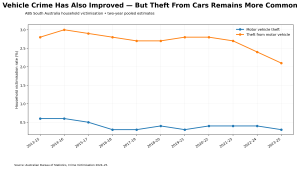
That distinction matters for Adelaide households. A driveway or street-parked vehicle can be exposed to theft from the vehicle even where the risk of the entire vehicle being stolen is comparatively low.
Where is recorded crime highest across Adelaide right now?
The newest Data SA suburb release is not a complete financial year. It covers the nine months from 1 July 2025 to 31 March 2026. The table below therefore compares it only with the same nine-month period one year earlier.
| Suburb | Postcode | 9 months to Mar 2026 | Same period prior | Change |
|---|---|---|---|---|
| Adelaide | 5000 | 5,871 | 6,443 | -8.9% |
| Salisbury | 5108 | 1,058 | 1,320 | -19.8% |
| Morphett Vale | 5162 | 1,047 | 1,098 | -4.6% |
| Oaklands Park | 5046 | 929 | 901 | +3.1% |
| Elizabeth | 5112 | 925 | 806 | +14.8% |
| Prospect | 5082 | 829 | 687 | +20.7% |
| Modbury | 5092 | 802 | 850 | -5.6% |
| Paralowie | 5108 | 734 | 699 | +5.0% |
| Davoren Park | 5113 | 709 | 740 | -4.2% |
| Smithfield | 5114 | 684 | 843 | -18.9% |
Source: SAPOL suburb crime statistics via Data SA, 2025–26 Q1–Q3 and the matched period of 2024–25.
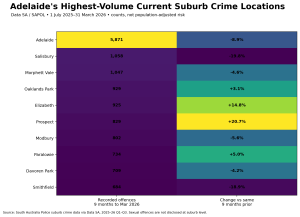
The Adelaide CBD is in a completely different category from ordinary residential suburbs: 5,871 recorded offences in nine months, compared with 1,058 in Salisbury and 1,047 in Morphett Vale.
That does not mean a CBD resident is five times more likely to be victimised. Adelaide contains offices, universities, hotels, shopping, nightlife, public transport and major events. Thousands of people who do not live in postcode 5000 use it every day.
The offence mix supports that interpretation. Of the CBD’s 5,871 current recorded offences, 4,325 were offences against property and 1,546 were offences against the person. A commercial and visitor-oriented centre naturally produces a very different denominator problem from a conventional residential suburb.
Does Adelaide CBD distort metropolitan crime comparisons?
Yes — if the comparison uses raw counts or a simple resident-population rate without visitor context.
The CBD has far more retail floor space, parked vehicles, workers, students, nightlife customers and visitors than its residential population alone suggests. The same issue applies on a smaller scale to suburbs containing major shopping centres such as Oaklands Park, Modbury and Elizabeth.
SAPOL’s own 2024 offence data for major shopping centres demonstrates the effect. Between January and November 2024, SAPOL recorded 647 theft-and-related offences at Westfield Marion, 327 at Westfield Tea Tree Plaza, 238 at Elizabeth Shopping Centre and 1,186 at Rundle Mall. Shop theft accounted for the majority of those theft offences.
Those offences are real. But they describe retail exposure, not just residential safety.
Adelaide’s Property Crime Winners and Losers
The most useful suburb story in the current data is not simply who sits at the top of the count table. It is who is moving.
To reduce random volatility, the comparison below focuses on suburbs with substantial current offence volumes and compares the same nine-month period year-on-year.
10 suburbs showing the strongest recent improvement
| Suburb | Prior 9 months | Current 9 months | Change |
|---|---|---|---|
| Findon | 561 | 405 | -27.8% |
| Glenelg | 531 | 406 | -23.5% |
| North Adelaide | 565 | 437 | -22.7% |
| Kilburn | 710 | 557 | -21.5% |
| Salisbury | 1,320 | 1,058 | -19.8% |
| Smithfield | 843 | 684 | -18.9% |
| Adelaide | 6,443 | 5,871 | -8.9% |
| Modbury | 850 | 802 | -5.6% |
| Morphett Vale | 1,098 | 1,047 | -4.6% |
| Davoren Park | 740 | 709 | -4.2% |
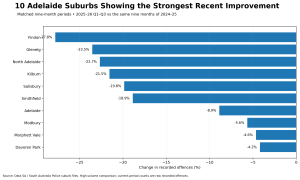
Findon fell 27.8%, Glenelg 23.5%, North Adelaide 22.7% and Kilburn 21.5%. Salisbury — despite remaining the second-highest current suburb count — fell almost 20%. Smithfield also fell 18.9%.
These are exactly the findings that disappear when crime coverage focuses only on “bad suburb” rankings. A place can still record a comparatively large number of offences while improving materially.
Where are the largest recent increases?
| Suburb | Prior 9 months | Current 9 months | Change |
|---|---|---|---|
| Hillbank | 213 | 367 | +72.3% |
| Elizabeth Park | 316 | 486 | +53.8% |
| Para Hills | 297 | 384 | +29.3% |
| Ingle Farm | 506 | 627 | +23.9% |
| Prospect | 687 | 829 | +20.7% |
| Elizabeth | 806 | 925 | +14.8% |
| Paralowie | 699 | 734 | +5.0% |
| Oaklands Park | 901 | 929 | +3.1% |
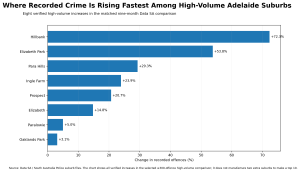
The increases are concentrated disproportionately in the northern corridor. Hillbank rose 72.3%, Elizabeth Park 53.8%, Para Hills 29.3% and Ingle Farm 23.9%. Prospect also rose 20.7%, although its offence mix is much more property-heavy than Elizabeth’s.
Importantly, nearby areas can move in opposite directions. Salisbury fell almost 20% while several suburbs further north increased. That is a strong argument against treating “northern Adelaide” as one homogeneous crime zone.
What about the largest 5-year and 10-year suburb improvements?
Data SA’s suburb archive extends back to 2010–11, which makes long-run suburb research possible in principle. But two methodological constraints matter.
First, the current 2025–26 file is only a partial financial year. Second, SAPOL changed its crime recording and reporting system from 1 July 2025 to align with a major ABS crime-coding revision. Top-level offences against property and offences against the person remain usable, but many lower-level offence names and groupings changed.
For that reason, this article does not splice a renamed 2025–26 theft category directly onto a 2015–16 category and call the result a precise ten-year suburb trend. Nor does it publish a fabricated “10-year suburb rate” using an incompatible population denominator.
The defensible long-term conclusion is instead built from the clean ABS household series and SAPOL’s complete annual data: residential break-in has fallen substantially over the decade and the decline is not a one-year statistical accident. Future updates to this article can extend the suburb-level long-run ranking once a full 2025–26 year is available under the new classification.
Inner North, Outer North, East, West and South Adelaide
There is no official Data SA “Inner North versus Outer North” field. The suburb dataset contains suburb, postcode and offence classifications, not an official metropolitan region label. The graphic below therefore uses a representative high-volume suburb from each broad part of Adelaide. It is designed to compare the scale and direction of well-known activity centres, not to claim a regional crime rate.
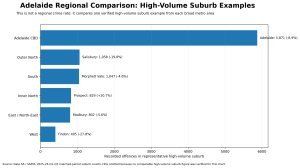
The contrast is useful. Adelaide CBD remains an outlier because of commercial and visitor activity. Salisbury and Morphett Vale show similarly high suburban volumes but are moving downward. Prospect is lower in absolute terms but rising quickly. Findon is lower and improving sharply.
The Adelaide Hills should be treated separately. Mount Barker is one of Greater Adelaide’s fastest-growing areas, adding about 1,200 residents in 2024–25, but no comparable high-volume suburb figure was inserted into this chart simply to fill the category. Population growth alone is not evidence of crime growth.
Are there pockets that contradict the “safe Adelaide” picture?
Yes. A low statewide household break-in rate does not mean every suburb has the same exposure.
Current recorded-offence volumes remain high in Salisbury, Morphett Vale, Elizabeth, Paralowie, Davoren Park and Smithfield. Several northern suburbs are also among the fastest current risers. At the same time, CBD and shopping-centre suburbs have unusually high counts driven partly by retail and visitor activity.
The correct conclusion is therefore not “Adelaide is safe everywhere”. It is that South Australia’s household break-in risk is comparatively low and has improved over the decade, while localised pockets and offence types can diverge sharply from that statewide pattern.
Where is car theft concentrated?
The household survey establishes the long-term direction — motor vehicle theft victimisation is down — but Data SA’s 2025–26 coding revision makes a direct lower-level suburb comparison with the old “Theft/Illegal Use of MV” category more difficult.
That matters because the article should not turn a coding change into a fake crime trend. The cleanest current conclusion is that vehicle-related exposure remains most relevant around dense activity centres, shopping and transport locations, and areas with large amounts of street or open-air parking.
SAPOL’s 2024 shopping-centre data provides a practical illustration: theft from motor vehicles was recorded at Elizabeth Shopping Centre, Westfield Marion, Arndale and Tea Tree Plaza even though retail theft dominated the totals. Parking environments generate a different security problem from residential burglary.
Methodology: counts, rates, victims and changing classifications
Recorded offences are not the same as victimisation
SAPOL and Data SA report offences recorded by police. ABS Crime Victimisation is a household survey and includes incidents whether or not they were reported to police. In the latest South Australian ABS estimate, 62.9% of households experiencing a break-in reported the most recent incident to police; the reporting rate for attempted break-in was only 40.0%.
That is why the police and survey datasets should complement one another rather than be forced to match.
Why this article does not publish official suburb crime rates
The Data SA suburb file publishes counts but does not contain a population field or an official rate. ABS population data uses statistical geographies that do not always align cleanly with SAPOL suburb names and boundaries. Greater Adelaide’s 2025 population of 1,491,015 is useful metropolitan context, but dividing every Data SA suburb count by a mismatched denominator would create false precision.
Why the 2025–26 classification change matters
SAPOL states that it updated its crime recording and reporting system from 1 July 2025 to align with a major ABS crime-coding revision. The 2024–25 annual report also notes small technical discrepancies in the refreshed 2023–24 and 2024–25 subcategory totals.
This means broad top-level comparisons remain useful, but analysts should be cautious when linking a renamed or split 2025–26 subcategory directly to an older offence label.
Why nine months are compared with nine months
The latest current suburb dataset covers July 2025 to March 2026. It is never compared with a full 12-month year in this article. Doing so would mechanically make the current period look about one-quarter lower even if nothing had changed.
Why small suburbs are not ranked by percentage change
Percentage change becomes unstable when an area records only a handful of incidents. The recent mover analysis therefore focuses on suburbs with substantial current recorded-offence volumes rather than selecting a tiny suburb where three extra incidents might produce a 300% increase.
What does this mean for Adelaide households and businesses?
The data supports a measured rather than alarmist response.
For houses, the long-run improvement in break-in is encouraging, but physical entry points still matter: doors, windows, garages, side gates and rear access. Vehicle keys should not be left where an intruder can easily reach them from an entry point.
For apartments, common entrances, basement parking, visitor access and storage areas are often more relevant than side access. In CBD and inner-city precincts, vehicle and opportunistic theft exposure can matter more than the metropolitan burglary average.
For retail businesses, current offence counts around major shopping centres show why shop theft should be treated as its own problem. Store layout, visibility, staff procedures and after-hours access need different controls from residential burglary.
Cameras, alarms, lighting and access control can form part of a security plan, but they should be matched to the offence pattern and property type rather than installed because a suburb appeared in a headline ranking.
The verdict: is Adelaide really one of Australia’s safest capitals?
For residential break-in, there is strong evidence supporting the claim. South Australia’s latest ABS household break-in victimisation estimate is 1.4%, below the national annual estimate of 1.8%, and the state rate has fallen markedly over the past decade.
But “safe capital” is too broad if it implies uniformity.
Adelaide CBD’s raw crime count is dominated by a much larger daytime, retail and nightlife population than its resident population. Major shopping-centre suburbs show a similar, smaller-scale distortion. Several northern suburbs are currently rising even as Salisbury, Smithfield, Kilburn and other high-volume areas improve.
The most defensible conclusion is therefore:
Adelaide has a comparatively favourable household burglary profile, and that profile has improved over the long term — but local property crime remains highly uneven, especially around high-activity centres and selected northern and southern suburbs.
That is a more useful answer than either “Adelaide is perfectly safe” or “these ten suburbs are dangerous”.