

















Melbourne Crime Statistics 2026: Where Car Theft, Burglary and Property Crime Are Rising Fastest Leave a comment
Melbourne crime statistics look very different when the question changes from “Which area records the most crime?” to “Which areas are changing fastest?”
That distinction matters in 2026.
Across the 31 metropolitan Melbourne council areas analysed by Security Wholesalers, there were approximately 451,912 recorded offences in the 12 months to 31 March 2026, down 0.9% from 455,951 a year earlier. After allowing for population growth, the metropolitan offence rate fell more clearly, from about 8,541 to 8,314 offences per 100,000 people.
But beneath that slight overall fall are much larger movements.
Motor vehicle theft continued rising. Residential burglary and aggravated residential burglary fell sharply from their 2025 peaks. Theft from vehicles eased but remained far above its pandemic-era level. Retail theft fell slightly in the latest year but was still more than double its 2021 level.
And geographically, Melbourne is becoming less uniform: some growth-corridor and inner-city areas have recorded very large five-year increases in property crime, while many established municipalities experienced substantial falls during the latest year.
Official data used
This analysis uses the Crime Statistics Agency Victoria’s Recorded Offences — Year Ending March 2026 and Recorded Offences by LGA — Year Ending March 2026 datasets, released on 18 June 2026. The LGA workbook also provides postcode and suburb/town offence counts from April 2016 onward. Source: Crime Statistics Agency Victoria recorded-offence data.
For population context, the Australian Bureau of Statistics estimated Greater Melbourne’s population at 5,435,590 at 30 June 2025. Source: ABS Regional Population.
The headline: Melbourne crime has eased — but car theft has not
The latest direction is better than the 2025 figures suggested. Across metropolitan Melbourne, total recorded offences fell about 0.9% in the year to March 2026, while the population-adjusted rate fell approximately 2.7%.
The major Melbourne property and personal-crime categories, however, moved in different directions.
| Recorded offence | YE Mar 2025 | YE Mar 2026 | One-year change | Change from YE Mar 2021 |
|---|---|---|---|---|
| Motor vehicle theft | 25,529 | 26,160 | +2.5% | +114.4% |
| Theft from motor vehicle | 69,729 | 68,646 | -1.6% | +73.2% |
| Residential burglary | 23,849 | 20,196 | -15.3% | +31.9% |
| Aggravated residential burglary | 6,262 | 5,016 | -19.9% | +91.8% |
| Property damage | 33,770 | 32,810 | -2.8% | +27.1% |
| Retail theft | 31,978 | 31,447 | -1.7% | +126.9% |
| Robbery | 3,292 | 2,770 | -15.9% | +25.0% |
| Assault | 36,179 | 35,862 | -0.9% | +15.2% |
Source: Security Wholesalers calculations from Crime Statistics Agency Victoria recorded-offence tables for the 31 metropolitan Melbourne LGAs. Latest period: 1 April 2025–31 March 2026; comparisons end March 2025 and March 2021. Dataset released 18 June 2026.
The most important number in that table is arguably motor vehicle theft. It is the only major property category examined here that increased in the latest year, despite several other offences moving down.
The five-year numbers need another warning: March 2021 was heavily affected by COVID-era restrictions. A comparison against 2021 can exaggerate the apparent rebound in offences associated with mobility, retail activity, parking and public places. That is why the longer series matters.
Melbourne crime over the longer term
The current CSA workbook contains annual March-year observations from year ending March 2017 through March 2026 — 10 reporting years covering offences recorded from April 2016 onward.
Across those 10 reporting points, metropolitan Melbourne’s recorded-offence count moved from 397,265 in 2017 to 451,912 in 2026, an increase of about 13.8%.
But the population-adjusted rate tells a different story: approximately 8,371 offences per 100,000 in 2017 versus 8,314 in 2026. Melbourne has considerably more recorded offences in absolute terms than at the start of the current series, but it also has many more people.
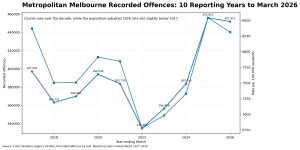
The composition of crime has changed much more than the overall rate. Between the March 2017 and March 2026 reporting points, metropolitan motor vehicle theft increased 37.0%, theft from vehicles increased 24.0%, retail theft increased 74.6% and assault increased 21.6%.
Residential burglary moved the opposite way: 27,548 residential burglary offences in 2017 versus 20,196 in 2026, a decline of about 26.7%. Robbery was also approximately 5.4% below its 2017 level.
Aggravated residential burglary is the exception inside the burglary story. It increased from 2,974 offences in 2017 to 5,016 in 2026, despite falling almost 20% in the most recent year.
Motor vehicle theft is the clearest continuing rise
Metropolitan Melbourne recorded 26,160 motor vehicle theft offences in the year to March 2026, up 2.5% from 25,529 in the previous year and more than double the March 2021 level.
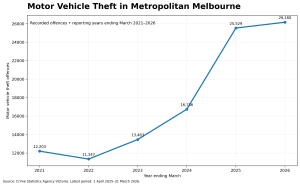
Graphic 2. Motor vehicle theft across metropolitan Melbourne. Source: Crime Statistics Agency Victoria. Reporting years ending March 2021–2026.
This is important because the latest overall crime decline can obscure the fact that vehicle theft has not yet followed burglary downward.
Residential burglary has reversed sharply from its 2025 peak
Residential burglary climbed from 15,309 offences in the year ending March 2021 to 23,849 in March 2025, before falling to 20,196 in March 2026. Aggravated residential burglary followed a similar pattern, falling from 6,262 to 5,016 in the latest year.
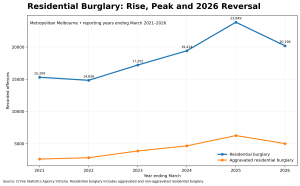
The fall is substantial, but aggravated residential burglary remains far above its 2021 level, so one year’s improvement should not be confused with a return to the earlier baseline.
Where the most crime is being recorded now
Counts identify where the greatest volume of police-recorded offending occurred. They do not by themselves measure the probability that an individual resident will become a victim.
| Crime type | Five metropolitan LGAs with the highest current offence counts |
|---|---|
| Motor vehicle theft | Casey 2,137; Melbourne 1,741; Hume 1,716; Wyndham 1,699; Greater Dandenong 1,334 |
| Theft from vehicle | Melbourne 5,448; Casey 4,898; Brimbank 3,396; Wyndham 3,380; Monash 3,160 |
| Residential burglary | Casey 1,332; Wyndham 1,258; Melbourne 1,187; Boroondara 1,077; Stonnington 928 |
| Aggravated residential burglary | Casey 551; Wyndham 420; Boroondara 386; Stonnington 221; Bayside 199 |
| Property damage | Melbourne 2,917; Casey 2,369; Greater Dandenong 1,712; Wyndham 1,613; Hume 1,595 |
| Retail theft | Melbourne 3,348; Wyndham 1,943; Casey 1,865; Darebin 1,603; Yarra 1,493 |
| Robbery | Melbourne 367; Casey 232; Wyndham 179; Greater Dandenong 155; Brimbank 145 |
| Assault | Melbourne 3,946; Casey 3,255; Hume 2,197; Wyndham 1,991; Greater Dandenong 1,870 |
Source: Crime Statistics Agency Victoria Recorded Offences by LGA, year ending 31 March 2026, released 18 June 2026.
Casey appears repeatedly because it is a very large and fast-growing municipality. Melbourne appears repeatedly for a different reason: the central city contains an exceptional concentration of workplaces, shops, transport, entertainment and visitors. Neither fact justifies calling either municipality Melbourne’s “most dangerous”.
Melbourne’s Crime Movers: The Areas That Changed Most
To identify change without creating an arbitrary “danger score”, Security Wholesalers created a transparent key property-crime basket:
motor vehicle theft + theft from motor vehicles + residential burglary + property damage + retail theft.
It is an analytical grouping for this article, not an official CSA crime category. The table compares the latest year with the directly comparable 12 months ending March 2025. The five-year direction is then used to distinguish a short-term movement from a longer change.
| LGA | YE Mar 2025 | YE Mar 2026 | Change | Biggest contributor | Longer direction |
|---|---|---|---|---|---|
| Casey | 10,815 | 12,601 | +16.5% | Theft from vehicle +890 | Five-year basket +107.8% — sustained rise |
| Port Phillip | 6,658 | 7,381 | +10.9% | Retail theft +565 | Five-year +93.6% — sustained rise |
| Brimbank | 6,672 | 7,334 | +9.9% | Theft from vehicle +621 | Five-year +35.5% — longer rise with latest-year acceleration |
| Maribyrnong | 5,480 | 5,757 | +5.1% | Theft from vehicle +368 | Five-year +80.6% — sustained rise |
| Stonnington | 6,369 | 6,633 | +4.1% | Theft from vehicle +430 | Five-year +75.9% — longer rise; burglary fell latest year |
| Melbourne | 15,664 | 14,641 | -6.5% | Retail theft -769 | Five-year +134.0% — major longer rise, currently easing |
| Darebin | 8,698 | 7,682 | -11.7% | Theft from vehicle -599 | Five-year +60.7% — latest fall reverses part of larger rise |
| Maroondah | 3,443 | 2,993 | -13.1% | Theft from vehicle -306 | Five-year +38.0% — latest-year correction |
| Banyule | 4,307 | 3,674 | -14.7% | Retail theft -217 | Five-year +46.1% — latest-year correction |
| Mornington Peninsula | 4,944 | 4,089 | -17.3% | Theft from vehicle -437 | Five-year +66.8% — sharp reversal from elevated level |
| Bayside | 2,993 | 2,461 | -17.8% | Theft from vehicle -174 | Five-year +29.3% — latest fall does not yet equal five-year decline |
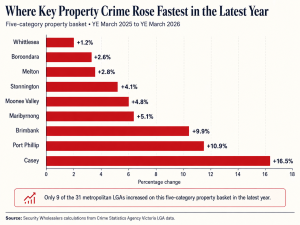
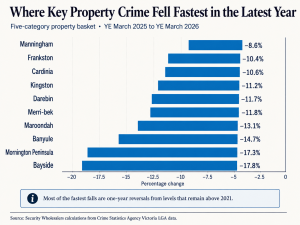
The most striking result is that short-term improvement and long-term improvement are not the same thing. Many of 2026’s fastest-falling municipalities remain well above their 2021 property-crime totals. That makes the latest reduction encouraging, but it is too early to describe most of those areas as having completed a longer structural decline.
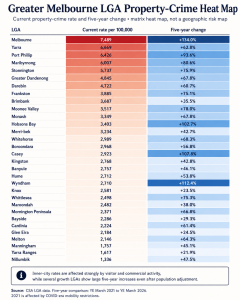
Growth corridors are changing — and population growth does not explain all of it
Rapid population growth obviously increases the number of homes, vehicles, shops and potential crime locations. Raw crime counts should therefore rise to some degree even if underlying risk does not.
But several growth municipalities have experienced increases that remain large after population adjustment. Between the March 2021 and March 2026 endpoints, the key property-crime basket rate rose approximately 78.2% in Casey, 72.4% in Wyndham, 51.0% in Whittlesea, 41.3% in Cardinia, 30.9% in Hume and 13.5% in Melton.
These calculations use CSA offence counts and its LGA population denominators. They suggest that population growth is part of the story but cannot explain the whole increase.
Suburb-level data reinforces the pattern, but there is an important limitation: CSA publishes suburb/postcode offence counts, not a ready-made comparable suburb population rate. The following figures therefore describe volumes, not individual risk.
| Suburb / postcode | YE Mar 2021 | YE Mar 2026 | Five-year change | Latest-year direction |
|---|---|---|---|---|
| Tarneit 3029 | 765 | 1,898 | +148.1% | +15.0% |
| Truganina 3029* | 423 | 1,302 | +207.8% | +7.0% |
| Narre Warren 3805 | 642 | 1,835 | +185.8% | +30.8% |
| Berwick 3806 | 691 | 1,589 | +130.0% | +32.5% |
| Cranbourne 3977 | 747 | 1,658 | +122.0% | +17.7% |
| Clyde North 3978 | 373 | 903 | +142.1% | -12.9% |
| Werribee 3030 | 1,057 | 1,880 | +77.9% | -14.8% |
| Craigieburn 3064 | 1,021 | 1,477 | +44.7% | -8.0% |
*Truganina crosses an LGA boundary; counts here combine matching CSA postcode/suburb records. Narre Warren also contains a major retail activity centre, so its increase should not be interpreted as purely residential.
Established suburbs have changed materially too
The story is not confined to the urban fringe. Five-year selected-property-crime counts increased from 779 to 1,818 in Footscray, 1,562 to 2,776 in Preston, 823 to 1,637 in South Yarra, 1,335 to 1,982 in Richmond, and 1,860 to 3,351 in Dandenong.
Some of these places are major retail, nightlife or transport centres, and several experienced substantial falls in the latest year. Preston, for example, was down about 14.2% from March 2025 to March 2026 even though its five-year total remained around 77.7% higher.
Southbank provides an even more striking example of changing urban form. Aggregated postcode/suburb data show the selected property basket increasing from 705 offences in the year to March 2021 to 2,202 in the year to March 2026, with theft from vehicles accounting for 1,021 of the latest total. Again, this is a raw count in a dense residential, commercial and visitor precinct — not a per-resident risk measure.
Why Melbourne CBD looks extreme in crime rankings
The City of Melbourne recorded 45,561 offences in the year ending March 2026, equivalent to a CSA population-based rate of about 23,304 offences per 100,000 residents.
Its selected property-crime basket alone contained 14,641 offences, including 5,448 thefts from vehicles, 3,348 retail thefts, 2,917 property-damage offences and 1,741 motor vehicle thefts.
Those figures are real, but the denominator is unusual.
Melbourne’s CBD is not used only by its residents. The central city concentrates employment, retail, transport, education, nightlife, tourism and events. That means a conventional crime rate divides offences generated by residents plus commuters, shoppers, tourists, students, nightlife patrons and businesses by a denominator based largely on residents.
Retail crime has an even bigger denominator problem. A shoplifting offence is related to the number of retail outlets, customers and transactions, not simply how many people sleep in the postcode.
The Melbourne 3000 postcode illustrates the difference. In the latest suburb dataset it recorded 2,273 retail-theft offences, 1,695 thefts from vehicles, 1,332 property-damage offences, 543 vehicle thefts and 345 residential burglaries.
Those categories describe a high-activity central business district far better than a single “crime rate” does.
Inner, middle and outer Melbourne are different crime environments
For this comparison, LGAs are grouped into inner, middle and outer/growth Melbourne to show broad differences in offence profile. The rates below are per 100,000 residents.
| Rate per 100,000, YE Mar 2026 | Inner Melbourne | Middle Melbourne | Outer / growth Melbourne |
|---|---|---|---|
| All recorded offences | 17,135 | 7,086 | 7,550 |
| Motor vehicle theft | 808 | 454 | 441 |
| Theft from vehicle | 2,614 | 1,282 | 1,008 |
| Residential burglary | 700 | 402 | 293 |
| Property damage | 1,187 | 510 | 562 |
| Retail theft | 1,408 | 525 | 466 |
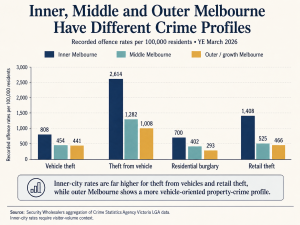
The inner-city figures are dramatically higher for theft from vehicles and retail theft. That should be interpreted alongside the CBD denominator issue, dense street parking, commercial land use, nightlife and visitor traffic.
Outer Melbourne has a different profile. Its overall rate is far below inner Melbourne, but vehicle theft now exceeds its residential burglary rate by a considerable margin.
Vehicle theft versus burglary: Melbourne’s risk profile is shifting
In many parts of Melbourne, protecting the car is becoming at least as relevant as protecting the front door.
| LGA | Vehicle theft: count / rate | Residential burglary: count / rate |
|---|---|---|
| Hume | 1,716 / 592 | 654 / 226 |
| Brimbank | 1,296 / 652 | 699 / 351 |
| Greater Dandenong | 1,334 / 792 | 763 / 453 |
| Maribyrnong | 922 / 962 | 526 / 549 |
| Casey | 2,137 / 496 | 1,332 / 309 |
| Wyndham | 1,699 / 465 | 1,258 / 345 |
| Melbourne | 1,741 / 891 | 1,187 / 607 |
| Port Phillip | 1,033 / 899 | 836 / 728 |
| Boroondara | 748 / 419 | 1,077 / 603 |
| Stonnington | 791 / 684 | 928 / 803 |
| Yarra | 699 / 686 | 742 / 728 |
| Mornington Peninsula | 462 / 268 | 647 / 375 |
Rates are per 100,000 residents.
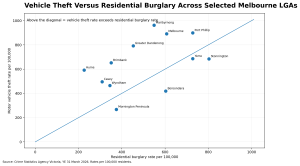
The contrast is particularly clear in Hume, where the latest data recorded 1,716 vehicle thefts versus 654 residential burglaries. Brimbank recorded 1,296 vehicle thefts versus 699 burglaries; Greater Dandenong 1,334 versus 763.
Other municipalities retain a more burglary-heavy profile. Boroondara recorded 748 vehicle thefts versus 1,077 residential burglaries, while Stonnington recorded 791 vehicle thefts against 928 burglaries.
That difference matters because the prevention problem is different. Vehicle theft is strongly connected to streets, driveways, car parks and access to keys; burglary is more directly connected to dwellings, garages, storage and physical entry.
What the crime data actually means for Melbourne households
Houses
Houses remain the dominant location for residential burglary. Across Victoria in the year ending March 2026, 83.6% of recorded aggravated residential burglaries occurred at houses, while houses accounted for 53.7% of non-aggravated residential burglary.
For detached homes, security therefore should not be thought of as just “door security”. Garage access, vehicle keys, driveway visibility and the connection between a garage and the dwelling matter as well.
Townhouses
The CSA’s standard location table does not provide a separate “townhouse” category, so there is no defensible townhouse-specific crime rate to publish.
In practical terms, townhouses combine several exposures: dwelling entrances, attached or shared garages, driveway parking and sometimes common pedestrian access. Their risk profile should therefore be interpreted from the surrounding residential and vehicle-theft data rather than from an invented townhouse statistic.
Apartments
Flats, units and apartments accounted for 9.3% of aggravated residential burglaries statewide and 12.3% of non-aggravated residential burglary.
Apartment security extends beyond the front door. Storage cages, common entrances and multi-dwelling car parks create shared access points, while dense precincts such as Southbank and Docklands combine residential, commercial and visitor activity.
Retail businesses
Retail premises have a fundamentally different exposure profile from houses. Metropolitan Melbourne recorded 31,447 retail-theft offences in the latest year, only 1.7% below 2025 but 126.9% above the March 2021 level.
Retail centres should therefore be assessed on customer volume, store layout, loss prevention and after-hours access rather than a suburb’s residential crime ranking.
Warehouses
For warehouses and industrial premises, non-residential burglary is more relevant than residential burglary. Perimeter access, loading zones, vehicle yards, keys, stock and after-hours entry are more useful security considerations than a neighbourhood-wide residential burglary statistic.
Security measures — including good locks, lighting, alarms, access control and cameras — are most useful when matched to the actual exposure rather than installed in response to a frightening suburb ranking.
Methodology and limitations
This analysis uses recorded offences, not a proprietary crime score.
An offence is counted by the Crime Statistics Agency when the conduct occurred in Victoria, was reported to or detected by Victoria Police and was recorded in the police system during the reference period. A single criminal incident can contain multiple recorded offences, so an offence count is not the same thing as the number of victims or separate criminal events.
The latest source is the CSA year ending 31 March 2026 release, published 18 June 2026. LGA, postcode and suburb data are drawn from the accompanying official recorded-offence workbook.
Metropolitan totals aggregate Victoria’s 31 metropolitan councils. For population-adjusted comparisons, CSA LGA population denominators are preferred because their geography corresponds directly with the offence tables.
Suburb and postcode figures are counts only in this article. We do not manufacture population-adjusted suburb rates where the official datasets do not provide a consistently matched denominator.
Finally, March 2021 is an unusual five-year comparison point because COVID restrictions materially affected mobility and recorded crime. Five-year changes are therefore shown alongside the latest one-year movement and the longer March 2017–2026 series.
The bottom line
Melbourne’s 2026 crime data is not a story of crime simply moving in one direction.
The latest year contains genuine improvement: residential burglary, aggravated burglary, robbery, theft from vehicles and property damage all fell across metropolitan Melbourne.
But the longer view is less reassuring for several property offences.
Vehicle theft is now more than twice its March 2021 level. Retail theft has more than doubled. Theft from vehicles remains approximately 73% higher. And several growth-corridor and inner-city municipalities have recorded large increases even after allowing for population growth.
At the same time, residential burglary remains substantially below its March 2017 level, demonstrating why “total crime” alone is a poor guide to what households and businesses are actually experiencing.
The most useful question is therefore not “Which Melbourne suburb is the most dangerous?”
It is:
What kind of crime is changing in this area, how quickly is it changing, and is that movement still occurring — or has it already begun to reverse?
That is what the 2026 data reveals.