


Australia Crime Rates 2026: Murder, Assault, Robbery, Sexual Assault, Theft & Car Theft by State Leave a comment
Australia crime rates: what the latest official data shows
Crime statistics can be confusing. A headline about “crime going up” may refer to raw police-recorded incidents, victimisation rates, offender numbers, household survey results, or a specific offence type in one state.
This article brings together the latest major Australian crime datasets to explain what is happening across serious violent crime, property crime and household security-related crime.
The focus is on offences that are often searched by the public, including murder, homicide, assault, sexual assault, robbery, break-ins, motor vehicle theft and other theft.
Before comparing crime rates, it is important to understand that not all crime statistics measure the same thing. The Australian Bureau of Statistics (ABS) Recorded Crime – Victims data is based on crimes recorded by police. The ABS Crime Victimisation survey is based on people and households reporting whether they experienced selected crimes. The Australian Institute of Criminology (AIC) National Homicide Monitoring Program is Australia’s dedicated homicide dataset.
For the clearest picture, the best approach is to use these sources together, rather than relying on one headline number.
Key Australian crime statistics
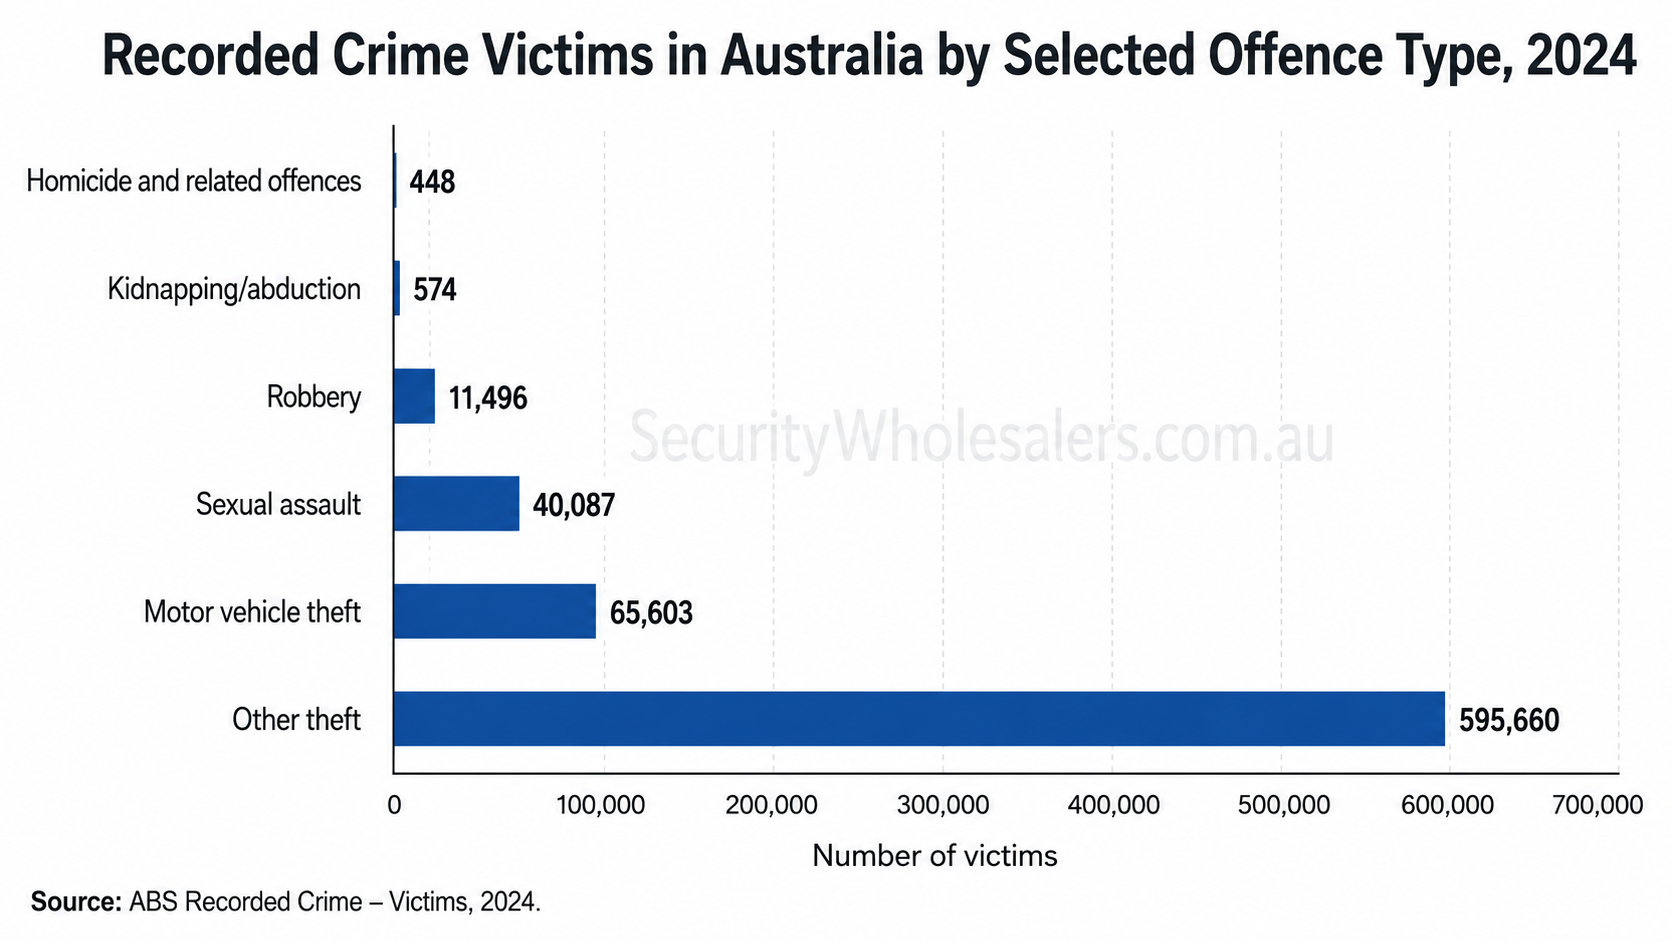
- In 2024, Australian police recorded 448 victims of homicide and related offences.
- Within that category, there were 252 recorded murder victims, 142 attempted murder victims and 53 manslaughter victims.
- The national victimisation rate for homicide and related offences was 1.6 victims per 100,000 people.
- The AIC National Homicide Monitoring Program recorded 264 homicide incidents and 279 homicide victims in 2024–25.
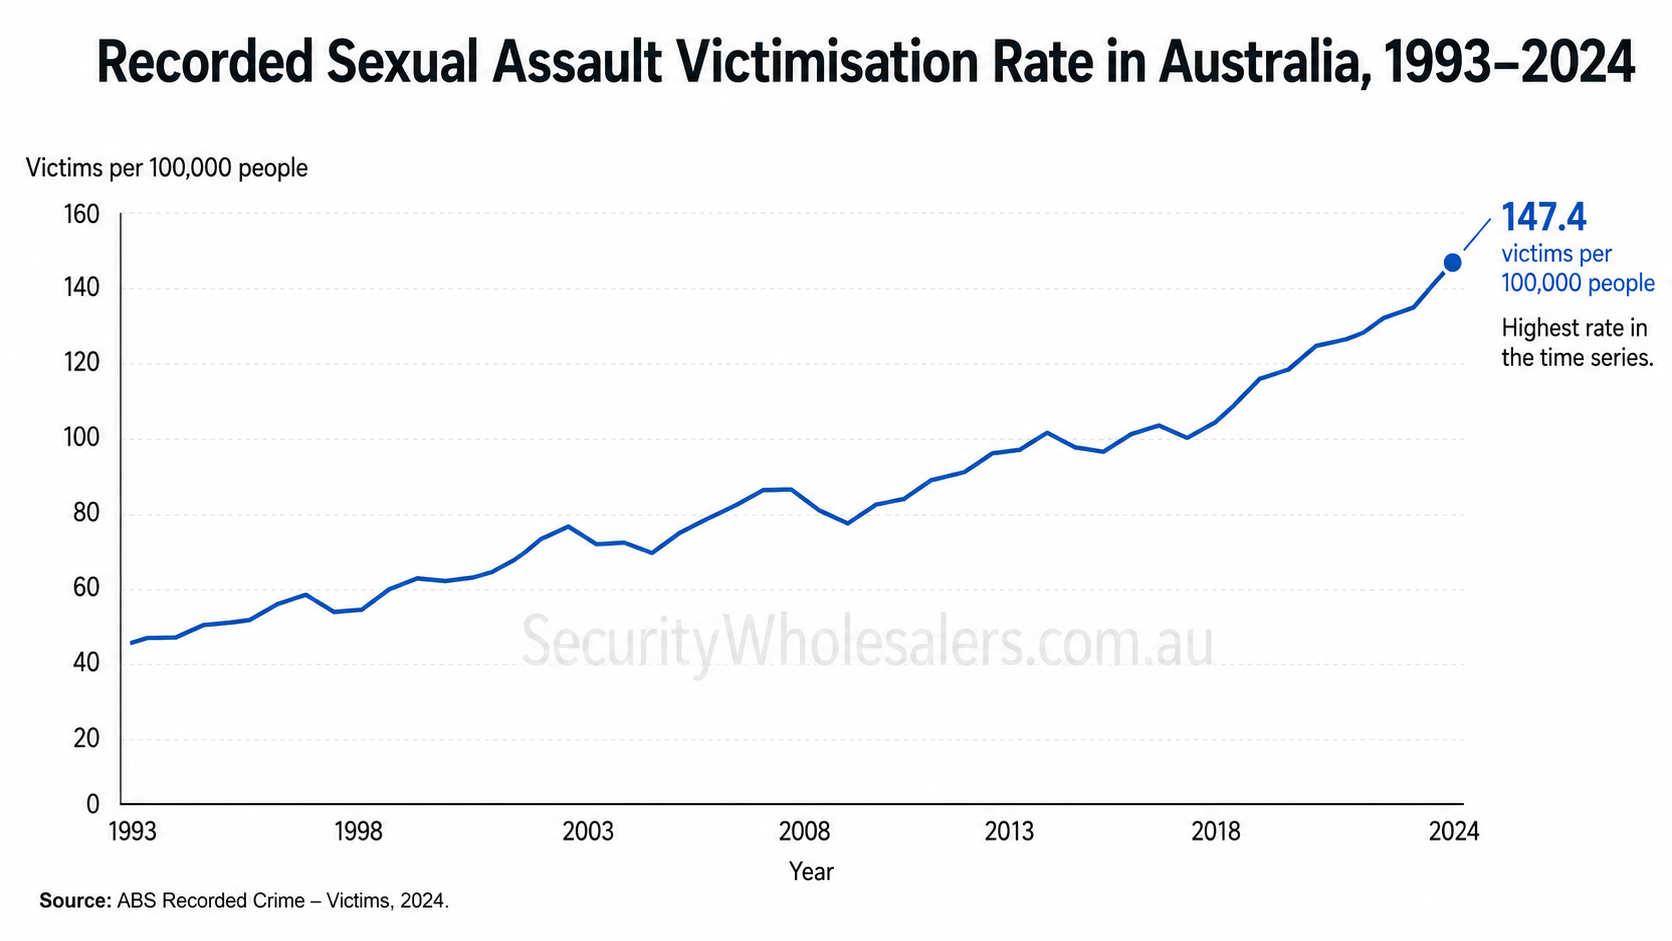
- There were 40,087 recorded sexual assault victims in 2024, the highest victimisation rate in the ABS time series.
- There were 11,496 robbery victims recorded in 2024.
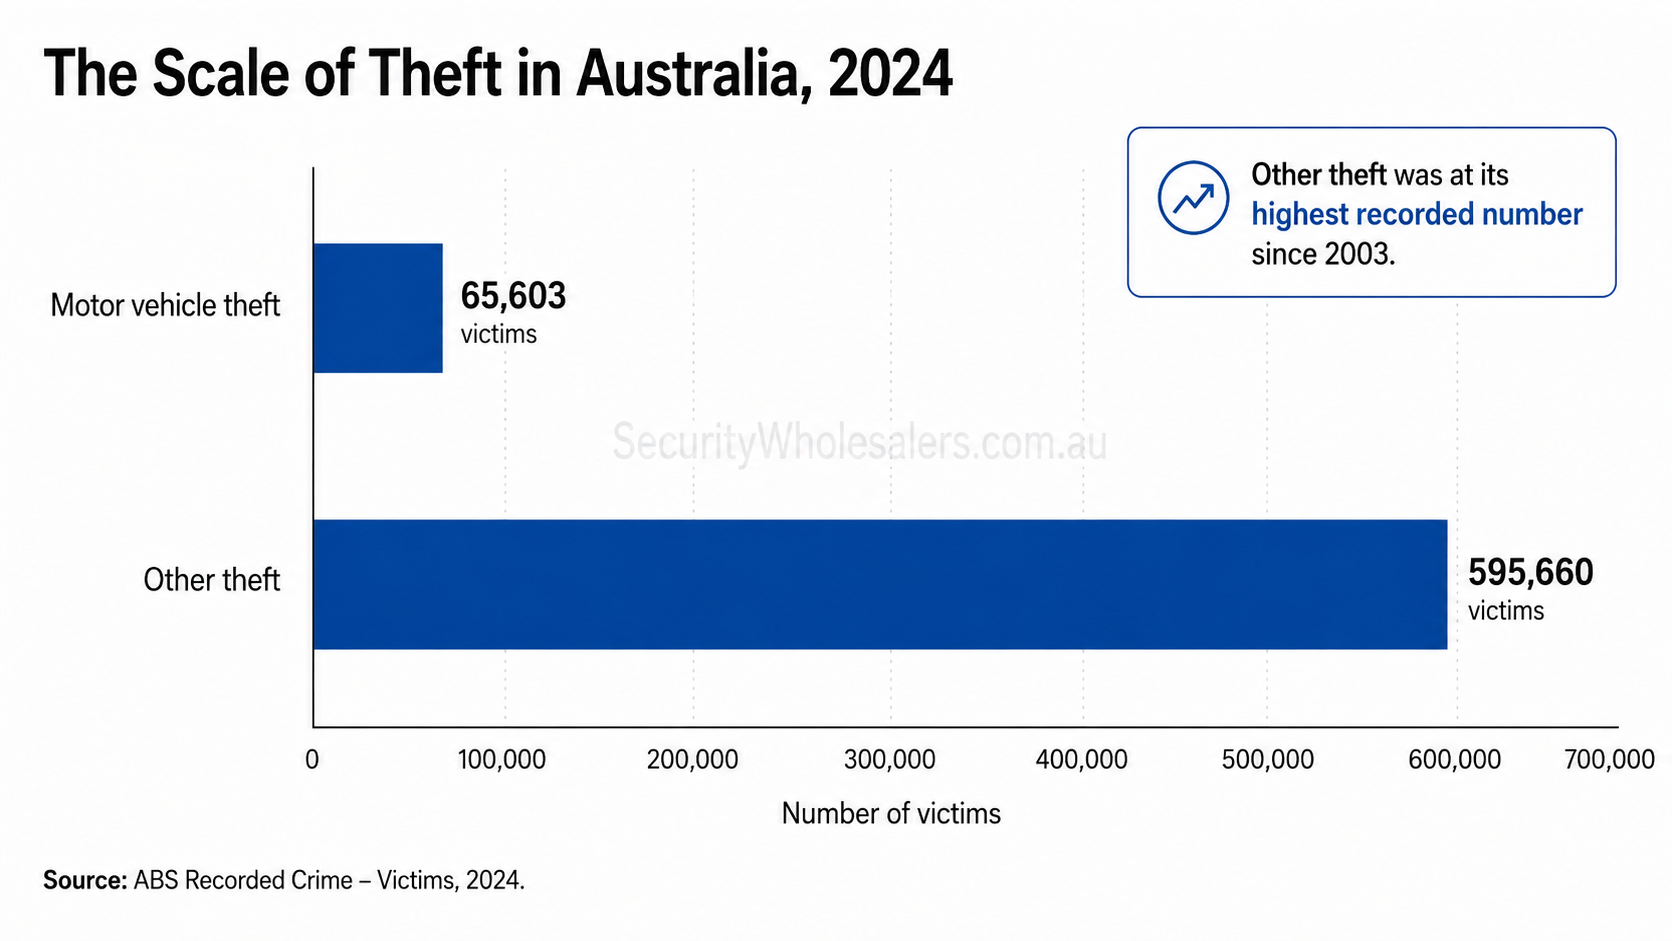
- There were 65,603 victims of motor vehicle theft recorded in 2024, up 8% from the previous year.
- There were 595,660 victims of other theft recorded in 2024, the highest recorded number since 2003.
- In 2024–25, ABS survey data estimated that 1.8% of Australian households experienced a break-in.
- In 2024–25, 2.2% of households experienced theft from a motor vehicle.
How to read Australian crime statistics properly
Crime data is useful, but only if it is interpreted carefully.
1. Raw numbers can be misleading
New South Wales, Victoria and Queensland often record the largest number of victims simply because they have the largest populations. A raw victim count does not necessarily mean a state has the highest crime rate.
For person offences such as homicide, murder and sexual assault, a rate per 100,000 people gives a better comparison between states and territories.
2. Police-recorded crime is not the same as all crime
ABS Recorded Crime – Victims data only includes selected crimes that were recorded by police. Some crimes are never reported. Others may be reported but classified differently depending on investigation outcomes and recording rules.
3. Survey crime data captures a different picture
ABS Crime Victimisation data asks people and households whether they experienced selected crimes. This can capture incidents that were not reported to police, but it is still limited to the offences included in the survey.
4. Homicide and murder are not exactly the same
In common language, people often search for “murder rates”. In official statistics, the broader category is usually homicide and related offences. This includes murder, attempted murder and manslaughter, but excludes driving causing death.
For this reason, this article uses both terms carefully:
- Murder refers to the specific ABS murder subcategory.
- Homicide and related offences refers to the broader ABS category.
- Homicide in the AIC dataset refers to incidents monitored through the National Homicide Monitoring Program.
National recorded crime victims by offence type
The table below shows selected national victim counts from ABS Recorded Crime – Victims, 2024.
| Offence type | Recorded victims, 2024 | Victimisation rate, where published | Notes |
|---|---|---|---|
| Homicide and related offences | 448 | 1.6 per 100,000 people | Includes murder, attempted murder and manslaughter. Excludes driving causing death. |
| Murder | 252 | 0.9 per 100,000 people | Specific subcategory of homicide and related offences. |
| Attempted murder | 142 | 0.5 per 100,000 people | Separate from murder. |
| Manslaughter | 53 | 0.2 per 100,000 people | Separate subcategory within homicide and related offences. |
| Sexual assault | 40,087 | 147.4 per 100,000 people | Highest recorded rate in the ABS time series. |
| Kidnapping/abduction | 574 | 2.1 per 100,000 people | Stable rate nationally. |
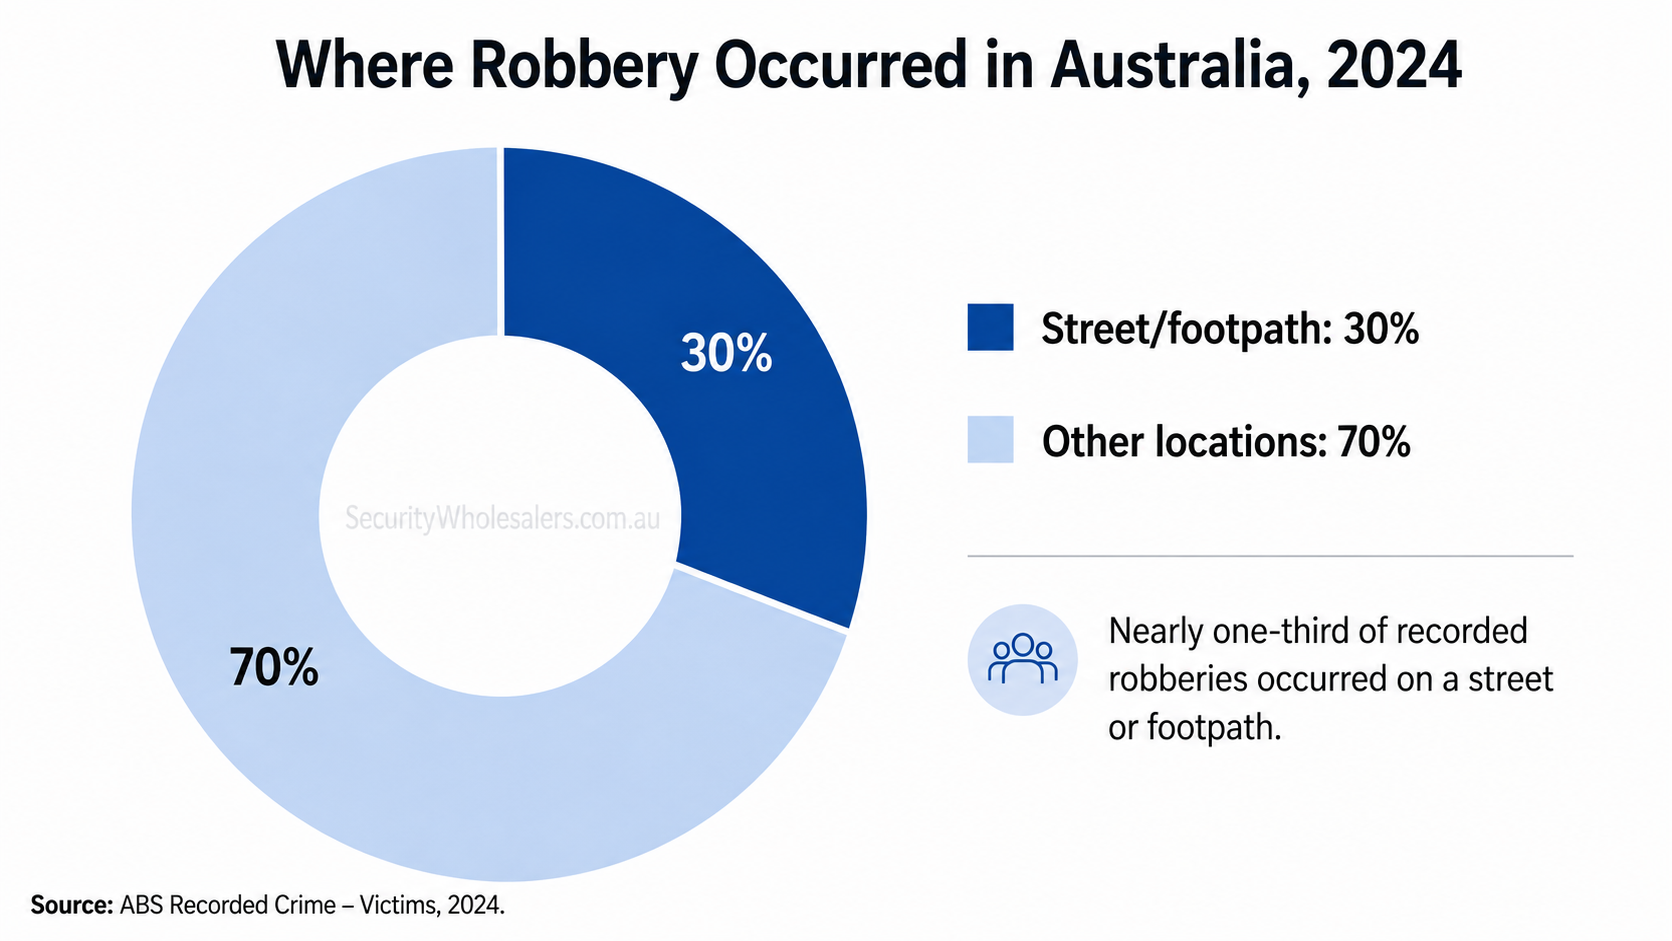
| Robbery | 11,496 | Not published in the same national rate table | Nearly a third occurred on a street or footpath. |
| Blackmail/extortion | 2,240 | Not published in the same national rate table | Recorded victims decreased from the previous year. |
| Motor vehicle theft | 65,603 | Not published in the same national person-offence rate table | Up 8% from 2023. |
| Other theft | 595,660 | Not published in the same national person-offence rate table | Highest recorded number since 2003. |
Note: ABS victimisation rates are displayed for person offences only. Some offences include non-person victims or a mix of person and non-person victims, so rates are not always published in the same way.
Murder and homicide rates in Australia
Serious lethal violence is rare in Australia compared with high-volume offences such as theft, break-ins and car theft.
In 2024, ABS Recorded Crime – Victims recorded:
- 448 victims of homicide and related offences;
- 252 murder victims;
- 142 attempted murder victims; and
- 53 manslaughter victims.
The national victimisation rate for homicide and related offences was 1.6 victims per 100,000 people. The murder victimisation rate was 0.9 per 100,000 people.
The AIC’s National Homicide Monitoring Program reported 264 homicide incidents, 279 homicide victims and 271 identified offenders in 2024–25. These figures differ from the ABS homicide and related offences category because the datasets have different counting rules, categories and reference periods.
Why homicide figures can differ between sources
It is normal for ABS and AIC homicide-related figures to differ. The ABS Recorded Crime – Victims category includes homicide and related offences, such as murder, attempted murder and manslaughter. The AIC National Homicide Monitoring Program is a dedicated homicide incident dataset.
For public-facing crime statistics, it is best to avoid saying “Australia had X murders” unless the source and category are clear. A safer phrase is:
“According to ABS Recorded Crime – Victims, there were 252 recorded murder victims in Australia in 2024, while the broader homicide and related offences category recorded 448 victims.”
Chart 1 — selected recorded crime victims

Homicide and murder by state and territory
The table below shows ABS Recorded Crime – Victims data by state and territory for 2024. Rates are per 100,000 people.
| State / territory | Homicide and related offences | Homicide-related rate | Murder victims | Murder rate | Attempted murder victims |
|---|---|---|---|---|---|
| New South Wales | 124 | 1.5 | 89 | 1.0 | 30 |
| Victoria | 112 | 1.6 | 65 | 0.9 | 30 |
| Queensland | 94 | 1.7 | 47 | 0.8 | 41 |
| South Australia | 35 | 1.9 | 11 | 0.6 | 21 |
| Western Australia | 55 | 1.8 | 24 | 0.8 | 16 |
| Tasmania | 10 | 1.7 | 3 | 0.5 | 4 |
| Northern Territory | 9 | 3.5 | 5 | 1.9 | 0 |
| Australian Capital Territory | 7 | 1.5 | 0 | 0.0 | 3 |
The Northern Territory had the highest homicide and related offence rate in this table, but the actual number of victims was small. This is why rates in smaller jurisdictions can move sharply from year to year.
Chart 2 — murder vs broader homicide category
Sexual assault in Australia
Sexual assault is one of the most serious areas of concern in the latest police-recorded crime data.
ABS Recorded Crime – Victims recorded 40,087 victims of sexual assault in Australia in 2024. This was an increase of 10% from the previous year. The national victimisation rate increased to 147 victims per 100,000 people, the highest rate recorded in the ABS time series.
Recorded sexual assault figures must be interpreted carefully. An increase in recorded victims may reflect changes in the actual incidence of sexual assault, changes in reporting behaviour, changes in police recording, or a combination of these factors.
Sexual assault by state and territory
| State / territory | Recorded sexual assault victims, 2024 | Victimisation rate per 100,000 people |
|---|---|---|
| New South Wales | 16,444 | 193.6 |
| Victoria | 7,121 | 102.4 |
| Queensland | 9,326 | 167.4 |
| South Australia | 1,958 | 104.0 |
| Western Australia | 3,721 | 125.0 |
| Tasmania | 567 | 98.6 |
| Northern Territory | 516 | 197.8 |
| Australian Capital Territory | 428 | 89.4 |
New South Wales recorded the largest number of sexual assault victims in 2024, while the Northern Territory recorded the highest victimisation rate per 100,000 people.
Chart 3 — Sexual assault victimisation rate over time
Assault rates in Australia
Assault data needs special care because not every assault measure is published in the same way across every state and territory.
In ABS Recorded Crime – Victims 2024, assault data for Victoria is not published in the same table, which means a simple national recorded-assault total is not available from that table in the same way as murder, sexual assault or robbery.
Where ABS state and territory recorded assault data is published, the 2024 victimisation rates were:
| State / territory | Recorded assault victims, 2024 | Victimisation rate per 100,000 people |
|---|---|---|
| New South Wales | 79,624 | 937.5 |
| Victoria | Not published | Not published |
| Queensland | 61,644 | 1,106.4 |
| South Australia | 23,374 | 1,241.6 |
| Western Australia | 47,045 | 1,580.1 |
| Tasmania | 4,412 | 767.6 |
| Northern Territory | 11,694 | 4,483.2 |
| Australian Capital Territory | 2,482 | 518.7 |
Among jurisdictions where the recorded assault rate is published, the Northern Territory had by far the highest rate in 2024. However, readers should avoid making simplistic comparisons without considering population size, demographics, reporting practices and local context.
For broader personal assault trends, ABS Crime Victimisation survey data is also useful because it measures whether people experienced physical assault, threatened assault, or both, even where incidents may not have been reported to police.
Robbery in Australia
Robbery is different from theft because it involves force or threat. A shoplifting incident may be recorded as theft, but an incident where someone uses force, threatens staff or uses a weapon may fall into a more serious category.
In 2024, ABS Recorded Crime – Victims recorded 11,496 robbery victims nationally. Nearly a third of robberies occurred on a street or footpath.
Robbery by state and territory
| State / territory | Robbery victims, 2024 | Armed robbery victims | Unarmed robbery victims |
|---|---|---|---|
| New South Wales | 2,267 | 986 | 1,278 |
| Victoria | 3,436 | 2,100 | 1,334 |
| Queensland | 3,009 | 1,445 | 1,562 |
| South Australia | 496 | 272 | 227 |
| Western Australia | 1,316 | 640 | 676 |
| Tasmania | 275 | 123 | 150 |
| Northern Territory | 517 | Not published | Not published |
| Australian Capital Territory | 182 | 66 | 118 |
Victoria recorded the highest number of robbery victims in 2024, followed by Queensland and New South Wales.
Chart 4 — Robbery locations
Break-ins and unlawful entry with intent
For home and business security, break-ins are one of the most practical crime categories to understand.
ABS Recorded Crime – Victims uses the offence category unlawful entry with intent. This includes incidents where a person unlawfully enters a structure with intent to commit an offence. It is broader than the everyday term “home break-in” because it can include residential and non-residential locations.
ABS Crime Victimisation survey data separately estimates household break-in rates. In 2024–25, an estimated 1.8% of Australian households experienced a break-in, while 2.0% experienced an attempted break-in.
Unlawful entry with intent by state and territory
| State / territory | Victims of unlawful entry with intent, 2024 | Incidents involving taking of property | Notes |
|---|---|---|---|
| New South Wales | 32,913 | 19,916 | Most occurred at a residential location. |
| Victoria | 45,895 | 26,377 | Highest Victorian count since 2016, but still below early-2000s levels. |
| Queensland | 45,273 | 25,346 | Majority occurred at residential dwellings. |
| South Australia | 9,901 | 6,291 | Most occurred at a residential location. |
| Western Australia | 16,607 | 12,114 | Includes incidents involving property taken. |
| Tasmania | 2,969 | 2,303 | Includes residential and non-residential locations. |
| Northern Territory | Not published | Not published | 2024 unlawful entry with intent data not published for NT. |
| Australian Capital Territory | 1,449 | 771 | Lowest number in the 32-year time series. |
Motor vehicle theft in Australia
Motor vehicle theft remains one of the most relevant crime categories for homeowners, renters, strata buildings and businesses with parking areas.
In 2024, ABS Recorded Crime – Victims recorded 65,603 victims of motor vehicle theft in Australia. This was an increase of 8% from the previous year.
The increase was not evenly spread. ABS reported that most states and territories recorded decreases, while Victoria and New South Wales recorded increases.
Motor vehicle theft by state and territory
| State / territory | Motor vehicle theft victims, 2024 |
|---|---|
| New South Wales | 12,319 |
| Victoria | 22,504 |
| Queensland | 17,493 |
| South Australia | 3,479 |
| Western Australia | 5,653 |
| Tasmania | 1,493 |
| Northern Territory | 1,737 |
| Australian Capital Territory | 920 |
Victoria recorded the largest number of motor vehicle theft victims in 2024, followed by Queensland and New South Wales.
Why car theft matters for home security
ABS Crime Victimisation data also shows that vehicle-related crime is often a home security issue. In 2024–25, an estimated 2.2% of households experienced theft from a motor vehicle. Of the most recent theft-from-vehicle incidents, a large share occurred while the vehicle was at home.
For homeowners, this means driveway, garage and carport security should be considered part of the home security plan.
Chart 5 — car theft by state
Other theft and retail theft
Other theft is one of the highest-volume recorded crime categories in Australia.
In 2024, ABS Recorded Crime – Victims recorded 595,660 victims of other theft, up 6% from the previous year. This was the highest recorded number since 2003.
Other theft includes theft offences such as shoplifting and pickpocketing, but excludes motor vehicle theft. The latest ABS data shows that retail locations have become a major part of Australia’s theft problem.
Other theft by state and territory
| State / territory | Other theft victims, 2024 | Retail-location share, where available |
|---|---|---|
| New South Wales | 118,533 | 45% |
| Victoria | 169,673 | Not stated in this summary table |
| Queensland | 152,421 | Not stated in this summary table |
| South Australia | 47,693 | 55% |
| Western Australia | 81,930 | Not stated in this summary table |
| Tasmania | 11,279 | Not stated in this summary table |
| Northern Territory | 7,904 | 43% |
| Australian Capital Territory | 6,227 | Not stated in this summary table |
Victoria recorded the largest number of other theft victims in 2024, followed by Queensland and New South Wales.
For retailers, this is one of the most important practical crime categories. High-volume theft can be costly even when individual incidents are low value. Retailers should focus on useful CCTV evidence, staff safety, high-value product areas, POS coverage, stockroom protection and clear incident reporting procedures.
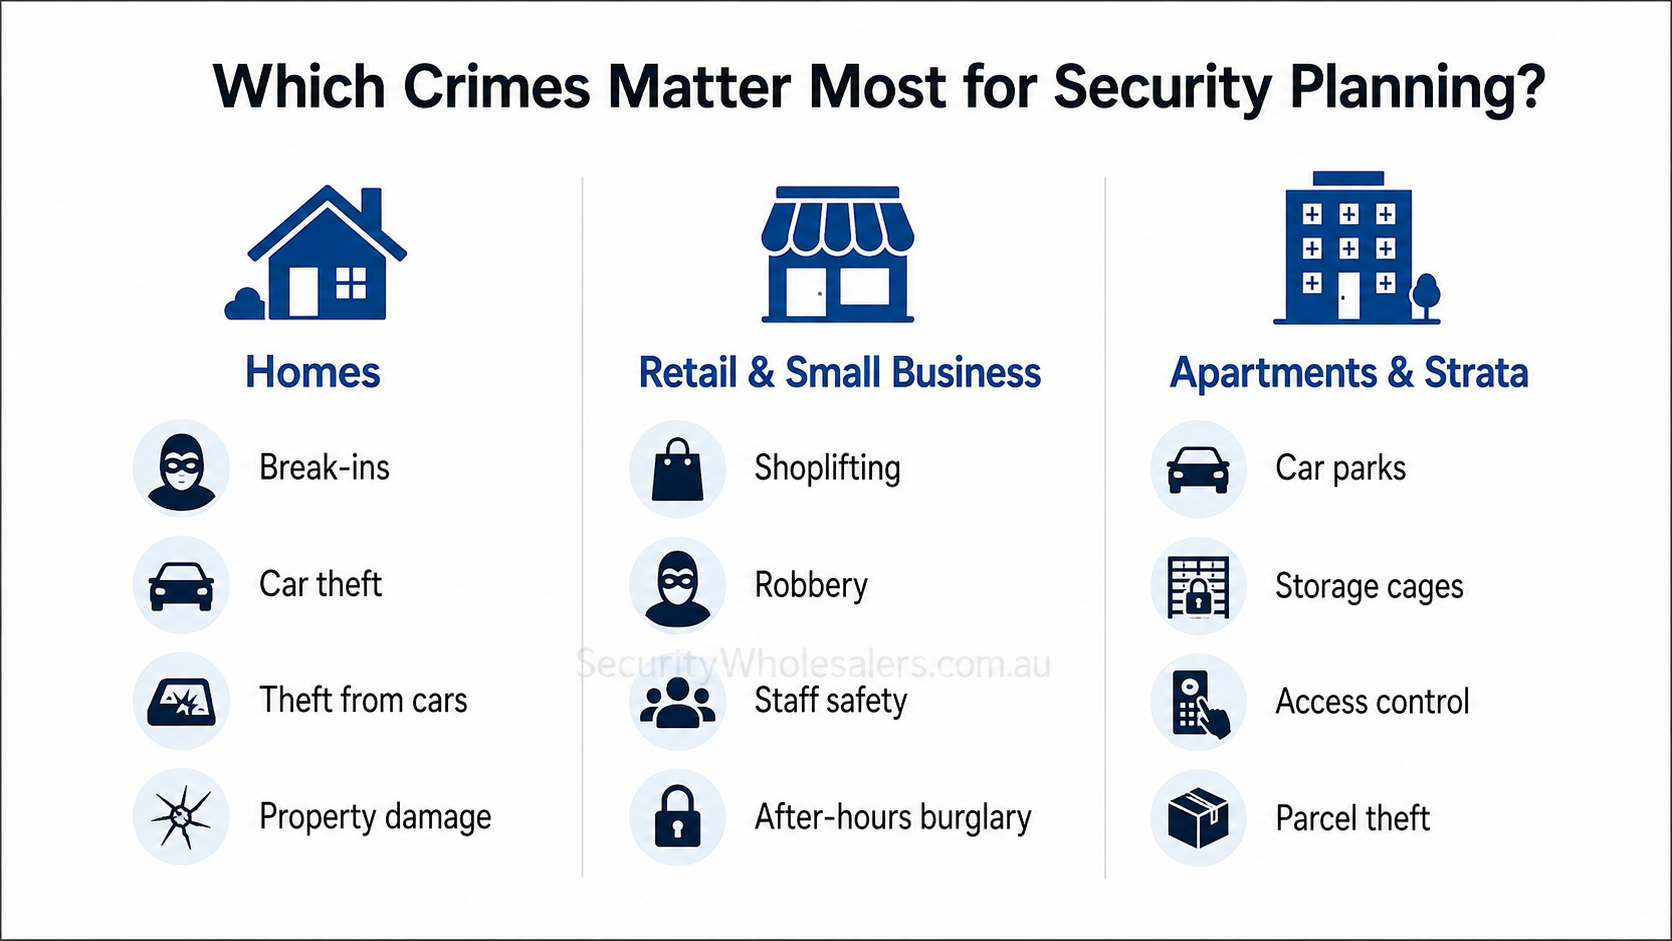
Which crimes are most relevant for home and business security?
Not every crime category has the same relevance for security planning.
For homeowners
The most practical security-related risks are usually:
- break-ins;
- attempted break-ins;
- theft from motor vehicles;
- motor vehicle theft;
- malicious property damage;
- garage and shed theft;
- side-gate and rear-access intrusion; and
- package theft or opportunistic front-door theft.
A home security system should usually prioritise the front entry, driveway, garage, side gate, rear door and outdoor storage areas.
For retailers
The most practical security-related risks are usually:
- shoplifting;
- repeat theft;
- aggressive customer behaviour;
- robbery;
- POS disputes;
- staff-only area access;
- stockroom theft; and
- after-hours break-ins.
Retail CCTV should not only provide wide coverage. It should capture usable evidence: faces, hands, product interaction, POS activity, exits and direction of travel.
For apartments and strata buildings
The most practical risks are usually:
- basement car park theft;
- theft from vehicles;
- storage cage theft;
- garage remote misuse;
- tailgating through secure doors;
- parcel theft;
- unauthorised lift or lobby access; and
- poor visitor management.
For strata buildings, cameras and access control should be designed around entries, car parks, lifts, foyers, storage areas and common access doors.
For warehouses and commercial sites
The most practical risks are usually:
- after-hours intrusion;
- tool and stock theft;
- loading dock access;
- yard theft;
- staff-only area access;
- vehicle gate control;
- delivery disputes; and
- internal shrinkage.
Warehouses often need a layered approach: perimeter cameras, access control, alarm detection, roller door sensors, staff entry controls and good lighting.
Diagram 1 — how crime statistics are counted
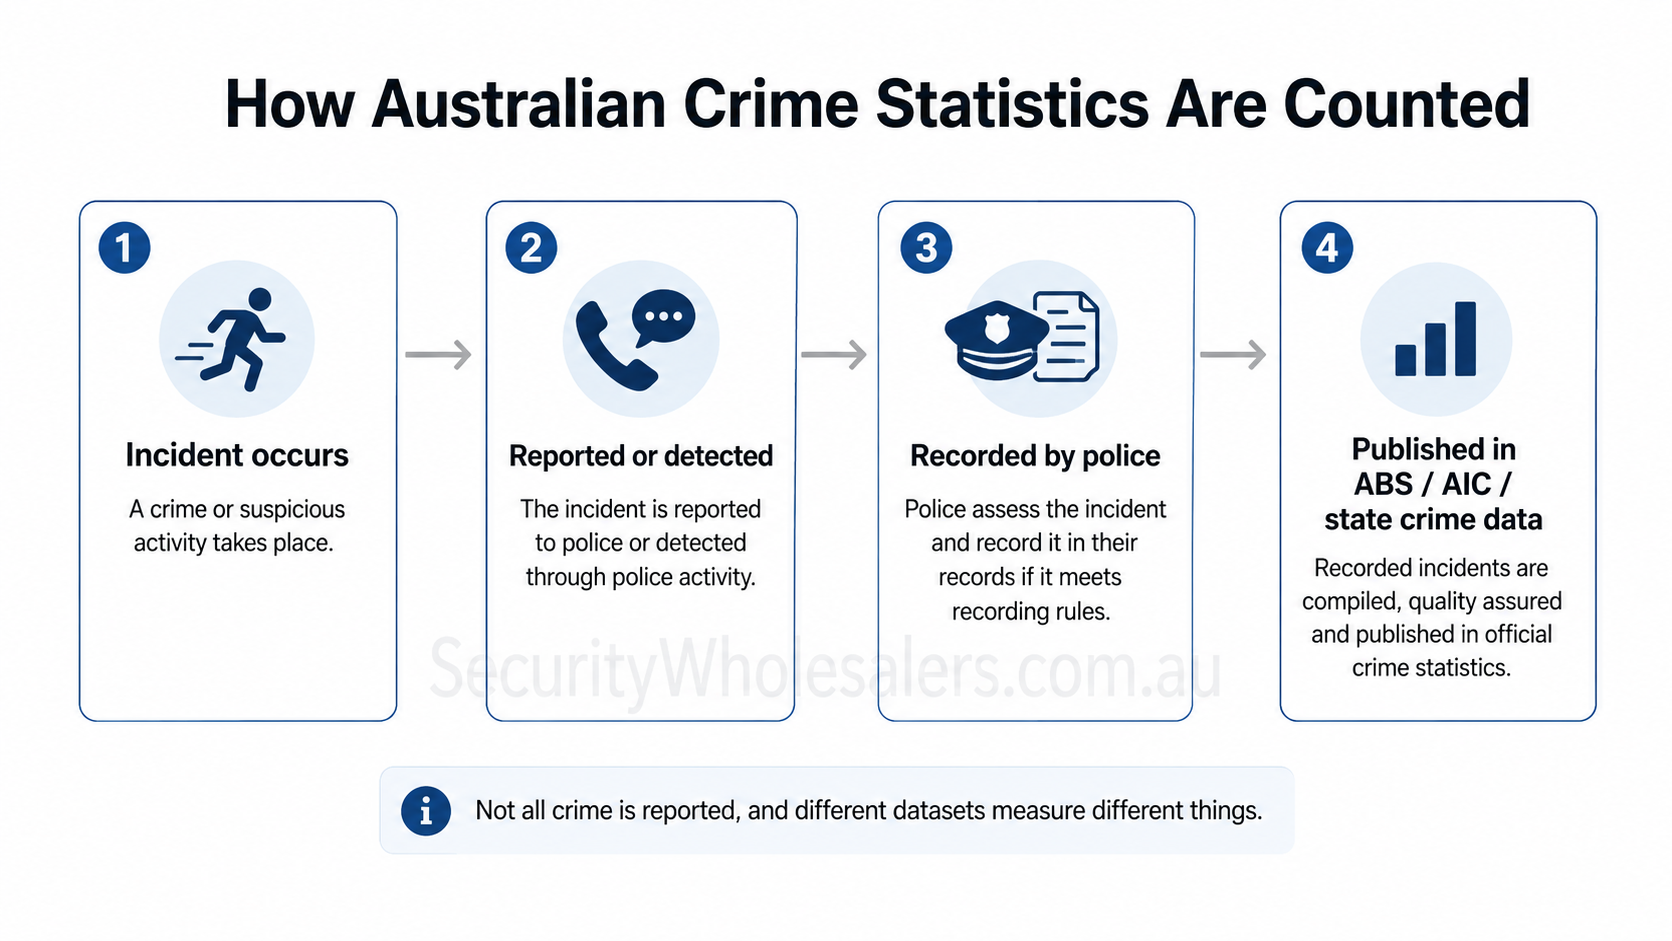
What does this mean for security planning?
The most serious crimes, such as murder and homicide, are rare but important to measure accurately. High-volume property crimes, such as theft, break-ins and motor vehicle theft, are more likely to affect everyday home and business security planning.
A practical security plan should be based on risk, not fear. For most homes and businesses, the goal is to:
- reduce easy opportunities;
- make entry points harder to access;
- improve lighting around weak points;
- capture useful CCTV evidence;
- detect movement or entry early;
- protect staff, residents and visitors; and
- make footage easy to find and export after an incident.
Diagram 2 — crime categories for security planning
Home security checklist
- Cover the driveway, not just the front door.
- Use cameras that capture faces, not only wide scenic views.
- Protect garages and sheds where tools, bikes and vehicles are stored.
- Use side-gate and rear-door coverage.
- Use lighting around dark side paths and rear access points.
- Keep car keys and garage remotes away from the front door.
- Check that CCTV time and date settings are correct.
- Make sure footage is retained long enough before being overwritten.
Business security checklist
- Place cameras at entrances for face capture.
- Cover POS/register areas.
- Cover high-value products and stockrooms.
- Use access control for staff-only doors.
- Protect rear doors, loading docks and warehouses after hours.
- Use alarms for intrusion detection.
- Ensure staff know how to save and export footage.
- Use signage where required and appropriate.
Methodology and data limitations
This article uses official Australian crime data from the ABS and AIC. The key sources are:
- ABS Recorded Crime – Victims, 2024;
- ABS Recorded Crime – Victims data downloads, especially national and state/territory tables;
- ABS Crime Victimisation, 2024–25;
- ABS Crime Victimisation methodology, 2024–25;
- ABS Recorded Crime – Offenders, 2024–25; and
- AIC Homicide in Australia 2024–25.
Important limitations:
- Police-recorded crime does not include every crime that occurs.
- Some crimes are under-reported.
- Different data sources measure different things.
- Raw victim counts should not be treated as crime rates.
- Rates in smaller jurisdictions can move sharply due to small changes in victim counts.
- Some offence data is not published for every state and territory.
- Some categories include non-person victims, which affects whether population rates are published.
The figures in this article should be used as a guide to broad trends and practical security planning, not as a complete measure of every crime committed in Australia.
Conclusion
Australia’s crime picture is mixed. Serious offences such as murder and homicide remain relatively rare, while high-volume offences such as theft, car theft, break-ins and sexual assault represent larger areas of recorded victimisation.
The most important lesson is that different crime types require different responses.
For households, the practical risks are often driveways, garages, side gates, rear doors, sheds and vehicles. For retailers, the major issues are theft, repeat offenders, staff safety and usable CCTV evidence. For strata buildings, the weak points are often basement car parks, storage cages, common entries and access control.
Good security planning should not be based on panic. It should be based on evidence, practical weak points and the crimes most likely to affect the property type.
References
- Australian Bureau of Statistics – Recorded Crime: Victims, 2024
- Australian Bureau of Statistics – Recorded Crime: Victims Methodology, 2024
- Australian Bureau of Statistics – Crime Victimisation, 2024–25
- Australian Bureau of Statistics – Crime Victimisation Methodology, 2024–25
- Australian Bureau of Statistics – Recorded Crime: Offenders, 2024–25
- Australian Institute of Criminology – Homicide in Australia 2024–25
- Australian Institute of Criminology – National Homicide Monitoring Program
- NSW Bureau of Crime Statistics and Research – Crime and Policing Statistics Dashboard