

















Canberra Crime Statistics 2026: How Safe Is Canberra Really? Burglary and Car Theft by Area Leave a comment
Canberra can have a relatively low overall recorded-crime profile and still contain meaningful local property-crime hotspots. Those two statements are not contradictory.
ACT Policing itself describes Canberra as one of Australia’s safest cities, and its latest complete annual report shows a long-term decline in recorded property offending. Total offences against property fell from 21,676 in 2015–16 to 13,985 in 2024–25, while the official property-offence rate fell to 2,957.9 per 100,000 people in 2024–25.
But the Australian Bureau of Statistics household survey complicates any simple “safest capital” claim. In the latest pooled ACT estimate, household break-in, attempted break-in, theft from vehicles and malicious property damage were all slightly higher than the corresponding national annual estimates. Meanwhile, ACT Policing’s newest district data shows Belconnen and Woden rising on a broad basket of property offences even as Gungahlin, Inner North and Molonglo improve.
The useful question is therefore not “Is Canberra safe?” in the abstract. It is:
Can a city with a strong long-term safety record still have localised burglary, vehicle-theft and retail/property crime problems?
The official data says yes.
Latest data used
The newest ACT Policing monthly spreadsheet is extracted from PROMIS, Autocite and the ACT Policing Fatal Register as at 1 July 2026 and contains monthly offences through June 2026. The latest full-year district comparison in this article is therefore 1 July 2025–30 June 2026 versus 1 July 2024–30 June 2025. The newest published ACT Policing Annual Report is 2024–25. Sources: ACT Policing Crime Statistics and ACT Policing Annual Report 2024–25.
The ABS estimates Canberra’s Greater Capital City Statistical Area population at 484,630 at 30 June 2025, up 6,200 or 1.3% in a year. The ACT’s state/territory population was approximately 484,800. Source: ABS Regional Population 2024–25.
The headline: Canberra’s long-term property crime is falling
The strongest evidence supporting Canberra’s low-crime reputation is the long annual series. Using the revised figures in ACT Policing’s current 2024–25 Annual Report, total offences against property fell by about 35.5% between 2015–16 and 2024–25.
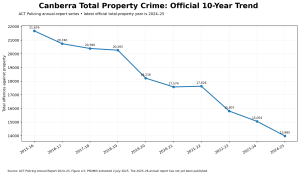
Exact data behind Graphic 1
| Financial year | Total offences against property |
|---|---|
| 2015-16 | 21,676 |
| 2016-17 | 20,740 |
| 2017-18 | 20,390 |
| 2018-19 | 20,265 |
| 2019-20 | 18,216 |
| 2020-21 | 17,574 |
| 2021-22 | 17,626 |
| 2022-23 | 15,807 |
| 2023-24 | 15,054 |
| 2024-25 | 13,985 |
Source: ACT Policing Annual Report 2024–25, Figure 4.5; PROMIS extracted 2 July 2025.
ACT Policing’s official total fell from 15,054 offences in 2023–24 to 13,985 in 2024–25, a decline of 7.1%. The annual report also recorded 718 dwelling burglaries, down 24.2%; 968 motor vehicle thefts, down 12.2%; and 3,169 property-damage offences, down 6.5%.
The newest 2025–26 monthly data is not yet accompanied by a published annual-report total because the monthly download does not separately expose every component of ACT Policing’s formal “other offences against property” category. It does, however, allow an exact current comparison of the main published crime categories.
Latest Canberra crime snapshot: 2025–26 versus 2024–25
| Published monthly category | 2024–25 | 2025–26 | Year-on-year | Five-year change |
|---|---|---|---|---|
| Burglary | 1,753 | 1,634 | -6.8% | -19.1% |
| Motor vehicle theft | 948 | 917 | -3.3% | -37.0% |
| Theft excluding motor vehicles | 6,805 | 7,553 | +11.0% | -2.8% |
| Property damage | 3,194 | 3,298 | +3.3% | -17.2% |
| Robbery | 173 | 207 | +19.7% | +35.3% |
| Assault | 3,265 | 3,113 | -4.7% | +8.4% |
Source: ACT Policing monthly offence spreadsheet, July 2020–June 2021, July 2024–June 2025 and July 2025–June 2026; PROMIS, Autocite and ACT Policing Fatal Register extracted 1 July 2026.
The latest year is mixed. Burglary fell 6.8%, motor vehicle theft fell 3.3% and assault fell 4.7%. But non-motor-vehicle theft rose 11.0%, property damage rose 3.3% and robbery rose 19.7%.
The theft increase requires context. ACT Policing’s definition of non-motor-vehicle theft includes stolen vehicle parts or contents as well as other non-vehicle theft. Its monthly district download does not provide a separate theft-from-vehicle or retail-theft series. The latest annual report does show that shop stealing increased from 1,712 offences in 2023–24 to 2,076 in 2024–25, a rise of about 21.3%. Retail theft is therefore clearly part of Canberra’s current property-crime picture, but this article does not invent district-level shoplifting numbers that ACT Policing has not published in the monthly file.
Burglary by district
The current ACT Policing monthly dataset publishes total burglary by district. Under ACT Policing’s definition, burglary is unlawful entry to a structure with intent to commit an offence and includes dwellings, shops, offices, factories and other secured structures. It is therefore broader than residential burglary alone. The monthly public download does not separately publish aggravated burglary by district.
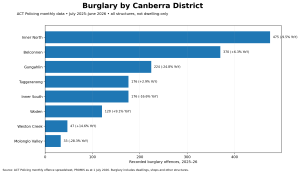
Exact data behind Graphic 2
| District | 2020–21 | 2024–25 | 2025–26 | YoY change | Five-year change |
|---|---|---|---|---|---|
| Belconnen | 447 | 348 | 370 | +6.3% | -17.2% |
| Gungahlin | 236 | 298 | 224 | -24.8% | -5.1% |
| Inner North | 456 | 525 | 475 | -9.5% | +4.2% |
| Inner South | 279 | 211 | 176 | -16.6% | -36.9% |
| Weston Creek | 109 | 41 | 47 | +14.6% | -56.9% |
| Molonglo Valley | 49 | 46 | 33 | -28.3% | -32.7% |
| Woden | 140 | 110 | 120 | +9.1% | -14.3% |
| Tuggeranong | 289 | 171 | 176 | +2.9% | -39.1% |
Source: ACT Policing monthly offence spreadsheet, PROMIS as at 1 July 2026.
Inner North recorded the largest burglary count in 2025–26, with 475 offences, followed by Belconnen with 370 and Gungahlin with 224. Tuggeranong and Inner South each recorded 176.
But the change story is different from the volume story. Gungahlin burglary fell 24.8% in the latest year, Molonglo fell 28.3%, Inner South fell 16.6% and Inner North fell 9.5%. Belconnen rose 6.3%, Woden 9.1%, Weston Creek 14.6% and Tuggeranong 2.9%.
The five-year comparison is broadly encouraging. Burglary is down 56.9% in Weston Creek, 39.1% in Tuggeranong, 36.9% in Inner South and 32.7% in Molonglo Valley. Inner North is the exception, sitting about 4.2% above its 2020–21 level.
Where is motor vehicle theft highest?
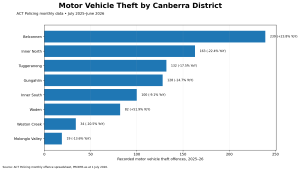
Exact data behind Graphic 3
| District | 2020–21 | 2024–25 | 2025–26 | YoY change | Five-year change |
|---|---|---|---|---|---|
| Belconnen | 304 | 193 | 239 | +23.8% | -21.4% |
| Gungahlin | 209 | 150 | 128 | -14.7% | -38.8% |
| Inner North | 274 | 210 | 163 | -22.4% | -40.5% |
| Inner South | 184 | 110 | 100 | -9.1% | -45.7% |
| Weston Creek | 71 | 38 | 34 | -10.5% | -52.1% |
| Molonglo Valley | 40 | 22 | 19 | -13.6% | -52.5% |
| Woden | 103 | 54 | 82 | +51.9% | -20.4% |
| Tuggeranong | 245 | 160 | 132 | -17.5% | -46.1% |
Source: ACT Policing monthly offence spreadsheet, PROMIS as at 1 July 2026.
Belconnen recorded the most motor vehicle theft offences in the latest year, at 239. Inner North recorded 163, Tuggeranong 132 and Gungahlin 128.
The most important recent movements are Belconnen’s 23.8% increase and Woden’s 51.9% increase. Woden’s percentage jump starts from a smaller base — 54 to 82 offences — which is exactly why percentage changes and counts should be shown together.
Despite those latest increases, every district remains below its 2020–21 motor-vehicle-theft count. The five-year declines range from about 20% in Woden and Belconnen to more than 50% in Weston Creek and Molonglo Valley.
Canberra crime heat map: where the current volume sits
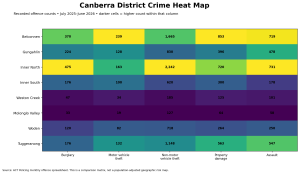
Exact data behind Graphic 4
| District | Burglary | Vehicle theft | Non-MV theft | Property damage | Assault |
|---|---|---|---|---|---|
| Belconnen | 370 | 239 | 1,665 | 853 | 719 |
| Gungahlin | 224 | 128 | 830 | 396 | 478 |
| Inner North | 475 | 163 | 2,242 | 720 | 731 |
| Inner South | 176 | 100 | 620 | 300 | 178 |
| Weston Creek | 47 | 34 | 185 | 125 | 101 |
| Molonglo Valley | 33 | 19 | 127 | 64 | 58 |
| Woden | 120 | 82 | 718 | 264 | 250 |
| Tuggeranong | 176 | 132 | 1,148 | 563 | 547 |
Source: ACT Policing monthly offence spreadsheet, July 2025–June 2026.
The heat map shows why “highest crime district” is an unhelpful label. Inner North has the highest burglary count and by far the largest non-motor-vehicle theft volume, but the area includes Canberra City and major shopping, nightlife, employment, education and visitor precincts. Belconnen also contains a major town centre and shopping complex. Woden, Gungahlin and Tuggeranong similarly combine residential suburbs with major retail and transport hubs.
A town centre with thousands of daily shoppers can record far more theft than a purely residential district without implying that every nearby household faces the same risk.
Safe City, Local Hotspots: How Both Can Be True
This is the central statistical lesson from Canberra.
At territory level, the official long-run property-crime series has fallen substantially. But localised movements can still go the other way.
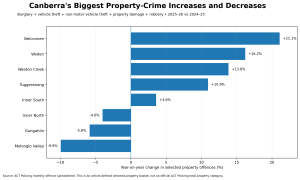
Exact data behind Graphic 5
| District | 2024–25 selected property | 2025–26 selected property | YoY change | Five-year change |
|---|---|---|---|---|
| Belconnen | 2,633 | 3,188 | +21.1% | -1.6% |
| Woden | 1,037 | 1,205 | +16.2% | +8.2% |
| Weston Creek | 347 | 395 | +13.8% | -39.7% |
| Tuggeranong | 1,847 | 2,049 | +10.9% | -7.8% |
| Inner South | 1,174 | 1,216 | +3.6% | -41.9% |
| Inner North | 3,803 | 3,651 | -4.0% | +3.1% |
| Gungahlin | 1,695 | 1,596 | -5.8% | -20.7% |
| Molonglo Valley | 272 | 245 | -9.9% | -34.3% |
Source: Security Wholesalers calculations from ACT Policing monthly published categories.
Belconnen recorded the largest latest-year increase, up 21.1%, followed by Woden at 16.2%, Weston Creek at 13.8% and Tuggeranong at 10.9%. Molonglo Valley fell 9.9%, Gungahlin fell 5.8% and Inner North fell 4.0%.
The five-year picture again differs. Inner South, Weston Creek and Molonglo are dramatically below their 2020–21 selected-property totals. Gungahlin is down 20.7%, Tuggeranong 7.8% and Belconnen is essentially flat. Inner North and Woden are the only two districts above their 2020–21 selected-property totals.
That is how a city can improve overall while particular districts or offence categories worsen temporarily.
Does the ABS household data support the “safest capital” claim?
Not unequivocally.
ACT Policing’s own annual report says Canberra remains one of Australia’s safest cities. The police-recorded long-term trend supports the idea that property offending has declined substantially. But the ABS Crime Victimisation Survey measures household experiences rather than police offence counts, and its latest ACT figures are not uniformly below the national benchmarks.
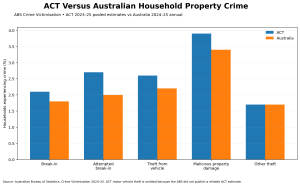
Exact data behind Graphic 6
| Household crime | ACT | Australia | ACT reference | Australia reference |
|---|---|---|---|---|
| Break-in | 2.1% | 1.8% | 2023-25 pooled | 2024-25 annual |
| Attempted break-in | 2.7% | 2.0% | 2023-25 pooled | 2024-25 annual |
| Theft from motor vehicle | 2.6% | 2.2% | 2023-25 pooled | 2024-25 annual |
| Malicious property damage | 3.9% | 3.4% | 2023-25 pooled | 2024-25 annual |
| Other theft | 1.7% | 1.7% | 2023-25 pooled | 2024-25 annual |
Source: Australian Bureau of Statistics, Crime Victimisation 2024–25.
The ACT’s break-in estimate is 2.1% versus 1.8% nationally; attempted break-in 2.7% versus 2.0%; theft from vehicles 2.6% versus 2.2%; and malicious property damage 3.9% versus 3.4%. Other theft is equal at 1.7%.
The ABS does not publish a reliable ACT motor-vehicle-theft victimisation estimate because the survey estimate has too much sampling error. That is why the motor vehicle theft bar is absent from the national comparison rather than filled with an invented number.
The two datasets are not contradictory. Police data counts offences known to ACT Policing; ABS measures households that report experiencing crime in a survey, whether or not every incident was reported to police. They answer different questions.
What crimes make up Canberra’s current picture?
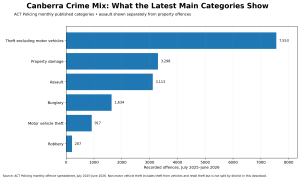
Exact data behind Graphic 7
| Category | 2025–26 recorded offences |
|---|---|
| Theft excluding motor vehicles | 7,553 |
| Property damage | 3,298 |
| Burglary | 1,634 |
| Motor vehicle theft | 917 |
| Robbery | 207 |
| Assault | 3,113 |
Source: ACT Policing monthly offence spreadsheet, July 2025–June 2026.
Non-motor-vehicle theft is by far the largest of the published monthly categories, at 7,553 offences. That category includes theft of motor vehicle parts or contents as well as other non-vehicle theft. Property damage accounted for 3,298 offences, assault 3,113, burglary 1,634, motor vehicle theft 917 and robbery 207.
The monthly data does not separate theft from vehicles or retail theft by district. Territory-level annual data confirms retail theft is significant: shop stealing rose from 1,105 offences in 2020–21 to 2,076 in 2024–25, an increase of almost 88% over four years.
Why this article does not publish “Canberra’s 10 most dangerous suburbs”
ACT Policing’s crime map is designed to allow suburb-level searching, but at the time of this analysis ACT Policing states that the public map is experiencing a technical issue and directs users to the downloadable spreadsheet instead. The current monthly spreadsheet provides ACT and district-level series rather than a stable suburb-by-suburb long-run dataset.
That limitation matters because suburb rankings are especially vulnerable to three problems:
- small populations: a handful of extra incidents can produce a dramatic percentage change;
- town centres and shopping centres: offences are generated by shoppers, workers and visitors who do not live in the area;
- boundary mismatch: ACT Policing patrol/statistical districts do not automatically match ABS population geographies closely enough to justify invented district rates.
For those reasons, this article publishes counts and change for the official district series and uses population-adjusted rates only at ACT level where the denominator is appropriate.
Methodology
Police data. The principal local source is ACT Policing’s monthly offence spreadsheet extracted on 1 July 2026. ACT Policing notes that its crime database is live and figures can change as incidents are reviewed, reclassified or updated.
Latest year. “2025–26” means 1 July 2025 to 30 June 2026. “Previous year” means 1 July 2024 to 30 June 2025. The five-year comparison is against 1 July 2020 to 30 June 2021.
Official total property crime. Graphic 1 uses the formal ACT Policing Annual Report total-property series through 2024–25. The 2025–26 annual report has not yet been published, so this article does not label the monthly main-category sum as the official total-property figure.
Selected property basket. For district change comparisons, this article sums burglary, motor vehicle theft, theft excluding motor vehicles, property damage and robbery. This provides a consistent district-level comparison but is not an official ACT Policing total because the monthly download does not separately publish every “other offences against property” component.
Burglary. The district monthly category includes unlawful entry to dwellings, shops, offices and other structures. It should not be read as a residential-burglary count. Territory-level annual data separately reports dwelling burglary. Aggravated burglary is not published as a standard separate district series in the current public monthly file.
Theft from vehicles and retail theft. ACT Policing’s monthly “Theft excluding motor vehicles” category includes vehicle parts/contents and other non-motor-vehicle theft. The monthly district dataset does not split these into separate theft-from-vehicle and shoplifting series. Retail theft is discussed using annual territory-level data where ACT Policing publishes it.
Population. ABS estimates Canberra GCCSA at 484,630 people at 30 June 2025. This is used for city context only. District rates are not calculated because patrol/statistical-zone boundaries and ABS population geographies are not guaranteed to align exactly.
ABS survey data. ACT household crime estimates are pooled across two survey years to improve reliability. The national figures are annual 2024–25 estimates. The different reference windows are shown explicitly.
Frequently asked questions
Is Canberra really one of Australia’s safest capitals?
Canberra has a strong long-term decline in police-recorded property crime, and ACT Policing describes it as one of Australia’s safest cities. However, ABS household victimisation data does not place the ACT below Australia on every property-crime measure. The most accurate answer is that Canberra’s overall recorded-crime trend is favourable, but “safest” depends on which offence and dataset is being compared.
Which Canberra district has the most burglary?
Inner North recorded the highest total burglary count in the ACT Policing monthly district data for July 2025–June 2026, with 475 offences, followed by Belconnen with 370. These counts include burglary of homes, shops and other structures.
Where is car theft highest in Canberra?
Belconnen recorded the largest motor vehicle theft count in 2025–26, with 239 offences. Inner North recorded 163 and Tuggeranong 132. Belconnen also increased 23.8% from the previous year.
Which district’s property crime increased the most?
On the article’s consistent five-category property basket, Belconnen increased 21.1% in 2025–26 compared with 2024–25. Woden increased 16.2%, Weston Creek 13.8% and Tuggeranong 10.9%.
Which Canberra areas improved?
Molonglo Valley recorded the largest latest-year decline in the selected property basket, down 9.9%, followed by Gungahlin down 5.8% and Inner North down 4.0%. Over five years, Inner South, Weston Creek and Molonglo show particularly large declines.
Does Canberra City distort Inner North crime figures?
It can. Inner North includes major employment, retail, nightlife, education and visitor activity around central Canberra. Raw theft and property counts therefore reflect a much larger “user population” than residents alone. That is why this article does not convert the count into a simplistic personal-risk score.
Is burglary increasing in Canberra?
Territory-wide monthly burglary fell 6.8% in 2025–26 compared with 2024–25 and is about 19% below the 2020–21 monthly total. District movements are mixed: Belconnen, Woden, Weston Creek and Tuggeranong rose in the latest year, while Gungahlin, Inner North, Inner South and Molonglo fell.
Practical security implications
The evidence suggests focusing on the offence relevant to the property rather than reacting to a generic suburb ranking.
For houses and townhouses, burglary prevention still means controlling access: reliable door and window locks, garage security, lighting and keeping vehicle keys away from obvious entry points. For vehicles, the latest Belconnen and Woden increases make secure parking, locking vehicles even at home and removing visible valuables particularly relevant.
Apartments and mixed-use precincts require attention to basement parking, shared entrances, storage cages and visitor access. Retail businesses should treat shop theft separately from burglary; ACT Policing’s annual data shows shop stealing has risen strongly even while overall property crime has fallen.
Security cameras, alarms and access control can support these measures, but the data does not justify treating every Canberra suburb as equally exposed or selling security products on the basis of fear.
The bottom line
Canberra can be a relatively safe capital overall and still have meaningful local property-crime problems.
The official long-run police series is favourable: total property offences fell by roughly one-third between 2015–16 and 2024–25. In the latest 2025–26 monthly data, burglary and motor vehicle theft also fell territory-wide.
But local changes matter. Belconnen and Woden moved sharply upward on several property measures. Inner North still records the largest burglary and theft volumes, partly because it contains Canberra’s central activity areas. Retail theft is rising at territory level. And the ABS household survey does not show the ACT outperforming Australia on every property-crime measure.
The correct interpretation is therefore neither “Canberra is perfectly safe” nor “these districts are dangerous”. It is that the citywide trend is broadly positive, while specific districts, town centres and offence categories can move differently enough to deserve their own analysis.