

















Darwin Crime Statistics 2026: Break-Ins, Vehicle Theft, Assault and Property Crime Explained Leave a comment
Darwin and the Northern Territory regularly sit near the top of Australian crime comparisons. That makes careful interpretation more important, not less.
A Territory-wide rate is not a Darwin suburb rate. Alice Springs is not Darwin. Palmerston is a separate urban centre. The NT Balance includes remote and rural communities. And even within Darwin, a single urban-centre total does not mean every suburb or household faces the same exposure.
This guide therefore starts with the official geography published by Northern Territory Police and the Attorney-General’s Department: Darwin, Palmerston, Alice Springs and the Northern Territory overall. It uses the latest monthly crime statistics through May 2026, official 12-month counts and rates, the pre-December-2023 historical series where it remains internally comparable, and Australian Bureau of Statistics household victimisation data for national context.
Critical methodology warning
NT Police implemented the SerPro system on 27 November 2023. The Attorney-General’s Department states that crime statistics from December 2023 onward are not comparable with earlier published NT crime statistics. The new series also uses ANZSOC 2023 offence classifications. This article therefore never draws a continuous trend line through the break. Historical 2018–2023 data and the new 2025/2026 annual comparisons are shown as separate series. Source: Northern Territory Crime Statistics, May 2026.
Darwin Crime Statistics at a Glance
| Measure | Latest figure | What changed? | Exact source period |
|---|---|---|---|
| Latest month | May 2026 | Assault 229; DV-related assault 114; sexual offences 16; house break-ins 48; commercial break-ins 13; motor vehicle theft 13; property damage 206; total property offences 497 | NT Crime Statistics, extracted 1 Jul 2026; May data provisional and may rise 10–15% |
| Assault | 2,341 | Down 12% from 2,666; rate 2,518.2 per 100,000 | 12 months Jun 2025–May 2026 vs Jun 2024–May 2025 |
| DV-related assault | 1,277 | Down 14% from 1,482; 54.5% of Darwin assaults classified as DV-related; rate 1,373.7 per 100,000 | 12 months ending May 2026; NT Police classification at time of offence |
| Sexual offences | 211 | Down 2% from 215; rate 227.0 per 100,000 | 12 months ending May 2026; published only at official urban-centre level |
| House break-ins | 405 | Down 24% from 532; rate 435.7 per 100,000 | 12 months ending May 2026 |
| Commercial break-ins | 137 | Down 56% from 312; rate 147.4 per 100,000 | 12 months ending May 2026 |
| Motor vehicle theft | 186 | Down 29% from 262; rate 200.1 per 100,000 | 12 months ending May 2026 |
| Other theft | 2,602 | Down 16% from 3,113; rate 2,799.0 per 100,000 | 12 months ending May 2026 |
| Property damage | 2,157 | Up 2% from 2,108; rate 2,320.3 per 100,000 | 12 months ending May 2026 |
| Robbery | 143 | Down 16% from 170; rate 153.8 per 100,000 | 12 months ending May 2026 |
| All property offences | 5,487 | Down 13% from 6,327; rate 5,902.4 per 100,000 | 12 months ending May 2026 |
Source for the table: Northern Territory Attorney-General’s Department / NT Police, crime statistics data through May 2026, extracted from SerPro on 1 July 2026. The May 2026 figures are provisional and may increase by a further 10–15%; January to April 2026 may increase by 5–10%. Source: official May 2026 statistical publication.
The headline is unusual but important: Darwin’s broad property-crime total fell 13% in the latest 12 months, while property damage rose 2%. House break-ins, commercial break-ins, motor vehicle theft, other theft and robbery all fell. Assault also fell 12%.
Darwin’s latest monthly picture
In May 2026, NT Police recorded 229 assaults, 48 house break-ins, 13 commercial break-ins, 13 motor vehicle theft offences, 206 property-damage offences and 497 total property offences in Darwin. The latest month’s numbers should not be treated as final because the statistical publication explicitly marks them provisional. Source: NT Police Darwin crime statistics.
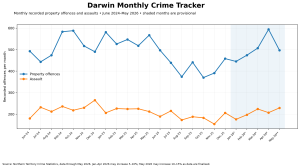
The monthly series fluctuates substantially, which is expected in a relatively small population. The official explanatory notes say certain NT offences can show strong seasonal impacts and caution against interpreting monthly fluctuations as trends.
However, the 24-month Darwin series available under the new system is not long enough to establish a stable recurring seasonal pattern for broad property offences or assault. The same calendar months do not move consistently in the same direction across the two available annual cycles. This article therefore does not attribute Darwin crime changes to weather, tourism, school holidays, alcohol availability or any other seasonal explanation based only on correlation.
Darwin’s Crime Profile Is Different From Other Capitals
The biggest difference is the relative weight of assault and property damage, rather than one isolated burglary statistic.
Darwin recorded 2,341 assaults in the 12 months ending May 2026, equivalent to 2,518.2 offences per 100,000 people. Property damage was almost as large in absolute terms at 2,157 offences, a rate of 2,320.3 per 100,000. Other theft contributed another 2,602 offences.
By comparison, house break-ins numbered 405 and motor vehicle theft 186. Those offences remain important for households, but they are not what principally drives Darwin’s overall recorded-crime profile.
Domestic-violence-related assault requires particular care. NT Police classified 1,277 Darwin assaults as involving domestic violence in the year ending May 2026, down 14% from 1,482 in the previous 12 months. That represented 54.5% of recorded Darwin assaults. The classification reflects NT Police’s assessment of domestic-violence involvement at the time the offence is recorded; it should not be treated as a complete measure of family and domestic violence prevalence, nor used to speculate about causes. Source: official May 2026 assault statistics.
Sexual offences are included only at geographic levels where the official publication reports them. Darwin recorded 211 sexual offences in the latest 12 months, down 2% from 215, with an official rate of 227.0 per 100,000. No smaller unsupported suburb-level sexual-offence ranking is created here.
House break-ins: lower in the latest year, but the five-year history needs a series break
Darwin recorded 405 dwelling burglaries — actual plus attempted house break-ins — in the 12 months ending May 2026. That is 24% lower than the 532 recorded in the preceding 12 months. Actual dwelling burglaries fell 32%, while attempted burglaries rose 16%. Source: NT Crime Statistics May 2026 Table 3.
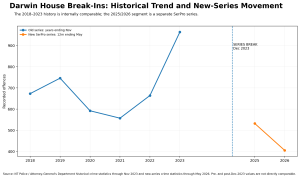
Before the recording break, the old Darwin series showed 673 house break-ins in the year ending November 2018, 557 in 2021 and 964 in 2023. That old series demonstrates a material rise between 2018 and 2023, but it cannot be directly joined to the 405 offences recorded in the new 2026 series.
In other words, it would be statistically wrong to claim that Darwin house break-ins have “fallen 58% since 2023”. The apparent difference includes a change in recording system and classification, not just a change in crime.
Commercial break-ins have fallen particularly sharply in the new series
Darwin recorded 137 non-residential burglaries in the latest 12 months, down 56% from 312. Actual commercial break-ins fell from 270 to 120 and attempts from 42 to 17. The current official rate is 147.4 per 100,000. Source: NT Crime Statistics May 2026.
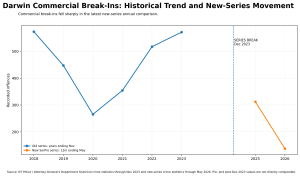
The old series itself shows why a longer window matters: commercial break-ins moved from 573 in 2018 down to 265 in 2020, then back to 571 by 2023. A single year would have captured only part of that movement.
Motor vehicle theft has fallen in Darwin, but not everywhere in the NT
Darwin recorded 186 motor vehicle theft and related offences in the year ending May 2026, down 29% from 262. Its official rate fell from 287.6 to 200.1 per 100,000.
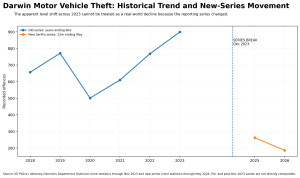
The current direction is not uniform across the Territory. Palmerston recorded 96 motor vehicle theft offences, up 13% from 85, even while its house and commercial break-ins fell. Alice Springs fell by 50%, from 180 to 90. Territory-wide vehicle theft fell 23%, from 673 to 515.
Property damage is the major exception to Darwin’s broad decline
Property damage rose from 2,108 to 2,157 offences in Darwin, an increase of 2%. Because Darwin’s population estimate also increased, the official rate was effectively flat: 2,313.7 per 100,000 in the year ending May 2025 versus 2,320.3 in 2026.
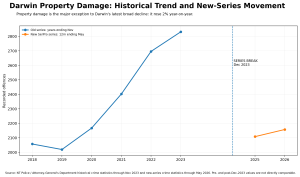
Property damage therefore deserves separate attention when describing the city. A statement that “Darwin property crime fell 13%” is true for the broad total, but it would conceal the fact that one of the city’s largest individual property categories increased.
Darwin versus Palmerston, Alice Springs and the NT overall
The table below reports count / official rate per 100,000 population for the latest 12 months.
| Geography | All property offences | Assault | House break-ins | Vehicle theft | Property YoY change |
|---|---|---|---|---|---|
| Darwin | 5,487 / 5,902.4 | 2,341 / 2,518.2 | 405 / 435.7 | 186 / 200.1 | -13.3% |
| Palmerston | 2,653 / 6,101.5 | 1,130 / 2,598.8 | 202 / 464.6 | 96 / 220.8 | +11.5% |
| Alice Springs | 4,084 / 13,083.0 | 1,896 / 6,073.8 | 676 / 2,165.6 | 90 / 288.3 | -34.6% |
| Northern Territory | 18,080 / 6,759.4 | 10,083 / 3,769.7 | 2,093 / 782.5 | 515 / 192.5 | -14.8% |
Source: NT Crime Statistics for the 12 months ending May 2026. Official population estimates used in the publication are Darwin 92,962; Palmerston 43,481; Alice Springs 31,216; Northern Territory 267,478.
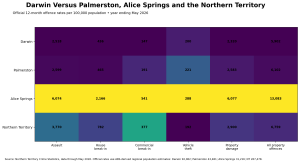
Darwin’s overall property-offence rate of 5,902.4 per 100,000 is lower than the NT-wide rate of 6,759.4 and far below Alice Springs’ 13,083.0. Palmerston’s current property-offence rate is slightly higher than Darwin’s at 6,101.5.
The offence profiles differ. Alice Springs has much higher rates of assault, house break-in and property damage. Palmerston’s assault rate is close to Darwin’s, but its property-damage rate is somewhat higher. Darwin’s robbery rate is higher than Palmerston’s but lower than Alice Springs’.
This is why it is misleading to describe an NT-wide rate as though it applies evenly across Darwin.
Darwin and the Northern Territory versus national household crime
The ABS Crime Victimisation Survey does not publish a Darwin-specific household victimisation estimate. The closest official household benchmark is the Northern Territory as a whole, so the chart below should be read as context for Darwin, not a Darwin household rate.
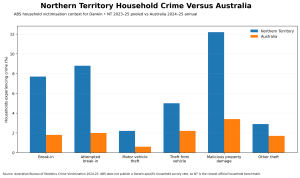
The gap is large on several household measures. ABS estimates that 7.7% of NT households experienced a break-in in the pooled 2023–25 reference period, compared with 1.8% nationally in 2024–25. Attempted break-in was 8.8% versus 2.0%; motor vehicle theft 2.2% versus 0.6%; theft from vehicles 5.0% versus 2.2%; and malicious property damage 12.2% versus 3.4%.
Those figures confirm that the Territory’s household property-crime burden is high by Australian standards. They do not establish that every Darwin household faces the NT average, because Darwin, Palmerston, Alice Springs, smaller towns and remote NT areas have different police-recorded offence profiles.
What does “theft” mean in the new Darwin statistics?
Under the new ANZSOC 2023 classification, Darwin recorded 2,788 theft offences in the year ending May 2026, including 186 motor vehicle theft and related offences and 2,602 “other theft” offences.
The new statistical publication does not expose every older theft subtype in the same way as the pre-2023 series. For that reason, this article does not attempt to manufacture a five-year “theft from vehicle” trend by mapping an old category onto the new residual “other theft” category.
This is another example of where methodological restraint produces a more trustworthy answer, even if it means a shorter list of long-run comparisons.
Is there evidence of seasonality?
The official NT explanatory notes state that certain offences can show strong seasonal impacts and that monthly regional figures can fluctuate considerably. But they also explicitly warn that those fluctuations should not, by themselves, be interpreted as changing crime trends.
For Darwin, the new monthly series currently provides only two complete June-to-May cycles. Broad property offences do not show a consistent same-month pattern across those two cycles, and assault shows only weak month-to-month repetition. That is not enough evidence to claim a reliable Darwin “crime season”.
Accordingly, this article does not attribute monthly rises to the wet season, dry season, tourism, school holidays or alcohol-related factors unless a separate credible study establishes such a relationship.
Methodology and limitations
The current NT crime statistics are prepared by the Northern Territory Attorney-General’s Department using offences recorded by NT Police. They are updated monthly and released on the third Friday of each month. Source: NT Police crime statistics.
The new series begins after SerPro implementation on 27 November 2023. The official publication states that December 2023 represents a break in the series and that data after that point should not be compared directly with older crime statistics. The newer publications also classify offences under ANZSOC 2023.
Latest-month data are provisional. In the May 2026 publication, NT Police notes that the latest month’s Territory figures may increase by 10–15% as investigations and data entry are completed, while the previous three months may increase by 5–10%. Regional revisions can be larger.
Counts and rates answer different questions. A count describes the volume of recorded offences. A rate adjusts for the published population estimate. Official May 2026 rates use ABS-derived December 2025 populations: Darwin 92,962; Palmerston 43,481; Alice Springs 31,216; NT 267,478.
These are urban-centre geographies defined by the NT statistics, not suburb-level rankings. Darwin consists of Darwin City and associated suburbs from Buffalo Creek, Berrimah and East Arm westwards. Palmerston and Alice Springs are separately defined urban centres. No claim is made that all Darwin suburbs experience the same risk.
Crime statistics are counts of offences, not unique victims, except where the publication specifically reports victim counts. A single event can generate multiple offences. The domestic-violence and alcohol-involvement flags reflect NT Police classification at the time of recording.
Practical security guidance tied to the data
Houses
House break-ins are down in the latest Darwin annual comparison, but 405 dwelling burglaries were still recorded. The practical priorities are therefore conventional physical entry points: external doors and windows, side and rear access, garages, sheds and visibility around entrances. Households should also consider where vehicle keys are stored, because vehicle theft and residential entry can overlap in opportunity even when they are separate statistical categories.
Businesses
Commercial break-ins fell sharply to 137 in the latest 12 months, but businesses should not interpret that as zero risk. Doors, shutters, rear service entrances, cash-handling areas, alarm coverage and after-hours access remain the most relevant controls for non-residential burglary.
Vehicles
Darwin recorded 186 motor vehicle theft offences in the latest year. Vehicles should be locked even on private property, keys kept away from obvious entry points, and valuables removed from sight. Where possible, off-street parking, gates, garages and lighting reduce the number of easy access opportunities.
Commercial compounds
For compounds, workshops and trade premises, the statistics point to a combined property-security problem rather than one offence alone: commercial burglary, vehicle theft, other theft and property damage. Perimeter gates, key control, lighting, vehicle immobilisation, tool and stock storage, and surveillance should therefore be designed as a layered system rather than around a single camera or alarm.
Security technology can support those controls, but the data does not justify fear-based messaging or treating every Darwin property as though it has the same exposure.
The bottom line
Darwin’s latest official crime data is more mixed — and in several respects more encouraging — than an NT-wide headline might suggest.
In the 12 months ending May 2026, Darwin recorded fewer assaults, house break-ins, commercial break-ins, motor vehicle thefts, other theft offences, robberies and total property offences than in the preceding 12 months. Property damage was the major exception, rising slightly.
Domestic-violence-related assault also fell in recorded volume, though it still accounted for more than half of Darwin assaults and must be interpreted sensitively. Palmerston moved differently from Darwin on several categories, while Alice Springs retained markedly higher population-adjusted rates for assault, house break-in and property damage.
The biggest methodological lesson is just as important: there is no honest five-year line connecting today’s Darwin crime statistics to the pre-December-2023 series. The official recording system changed, and this article shows that break rather than smoothing it away.
That is the right way to use Darwin crime statistics: separate Darwin from the Territory as a whole, distinguish counts from rates, treat provisional monthly data cautiously, and focus on the offence categories that actually affect the property or household being assessed.