

















Hobart Crime Statistics 2026: How Hobart, Glenorchy, Clarence, Kingston and Bridgewater Compare Leave a comment
Greater Hobart is too small — and Tasmania Police’s public geography is too specific — for a credible “50 safest suburbs” article.
That is not a weakness in the data. It is a reason to use the data properly.
Tasmania Police publishes current and historical performance information by police district and division, including the five Greater Hobart divisions most useful for local comparison: Hobart, Glenorchy, Kingston, Bridgewater and Clarence. Those divisions do not map neatly onto individual suburbs, council boundaries or the Australian Bureau of Statistics’ Greater Hobart capital-city boundary. A Bridgewater Division figure, for example, covers more than the suburb of Bridgewater; the official police-station directory shows stations including Bridgewater, New Norfolk, Kempton and other locations within that division.
This analysis therefore compares the official geographies that Tasmania Police actually publishes. It does not turn a division total into a made-up suburb crime rate.
Latest data used
The latest division-level figures are from the Tasmania Police Corporate Performance Report, Annual 2025–26, executed 4 August 2026. State-level offence definitions and five-year context also use the official Crime Statistics Supplement 2024–25, while the Tasmania Police Reporting Dashboard is the current public reporting interface. ABS Crime Victimisation 2024–25 provides the household comparison with Australia. Sources: Tasmania Police Our Performance, 2025–26 Corporate Performance Report, 2024–25 Crime Statistics Supplement and ABS Crime Victimisation.
There is an important source distinction. Tasmania Police explicitly says its Corporate Performance Report is primarily an internal performance document and may differ slightly from official departmental statistics. The Crime Statistics Supplement is the formal annual statistical publication, but at the time of this analysis the newest supplement is 2024–25. This article uses the 2025–26 performance report for the latest divisional movement and labels it as such rather than pretending the two publications are identical.
The short answer: is Greater Hobart crime rising or falling?
In the latest year, property crime fell overall across the five focus divisions.
Hobart, Glenorchy, Kingston, Bridgewater and Clarence recorded a combined 12,860 offences against property in 2025–26, compared with 13,568 in the previous financial year — a decline of about 5.2%.
But the five-year story is different. The same five divisions recorded 7,855 property offences in 2020–21. The 2025–26 total is therefore about 63.7% higher than the pandemic-era baseline. Property crime peaked at 14,340 offences in 2023–24 and has now fallen for two successive years.
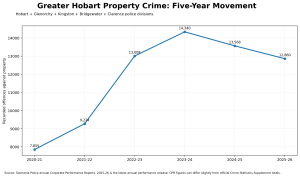
The practical conclusion is not “crime is rising” or “crime is falling”. Greater Hobart is improving from its 2023–24 property-crime peak, but remains well above 2020–21.
How Hobart, Glenorchy, Kingston, Bridgewater and Clarence compare now
The following table shows 2025–26 recorded offences, with the year-on-year change in brackets.
| Police division | Property offences | Home burglary | Vehicle burglary | Stolen vehicles | Property damage | Public-place assault | Robbery |
|---|---|---|---|---|---|---|---|
| Hobart | 4,086 (+2.9%) | 124 (+6.0%) | 297 (+28.0%) | 234 (+9.9%) | 466 (+2.6%) | 226 (+10.2%) | 65 (+47.7%) |
| Glenorchy | 2,819 (-7.3%) | 120 (-13.7%) | 178 (+3.5%) | 208 (+5.6%) | 462 (-18.4%) | 93 (-23.1%) | 30 (-26.8%) |
| Kingston | 1,307 (+17.4%) | 54 (-3.6%) | 85 (+46.6%) | 85 (+11.8%) | 164 (-7.3%) | 34 (-38.2%) | 5 (-16.7%) |
| Bridgewater | 1,949 (-22.3%) | 102 (-28.2%) | 83 (-32.0%) | 131 (-7.1%) | 421 (-25.9%) | 72 (-13.3%) | 15 (-42.3%) |
| Clarence | 2,699 (-8.0%) | 102 (-17.7%) | 134 (-12.4%) | 147 (-30.3%) | 350 (-8.9%) | 95 (+33.8%) | 27 (+8.0%) |
Source: Tasmania Police Corporate Performance Report, Annual 2025–26.
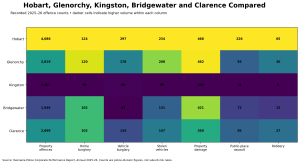
Hobart Division records the highest current property-offence volume, at 4,086, followed by Glenorchy at 2,819 and Clarence at 2,699. Hobart rose 2.9% in the latest year, while Kingston rose 17.4%.
Bridgewater moved in the opposite direction. Its property-offence count fell 22.3%, from 2,509 to 1,949 — the largest decline among the five divisions. Glenorchy fell 7.3% and Clarence 8.0%.
That makes Kingston the clearest current deteriorating division on the broad property measure, and Bridgewater the clearest latest-year improver. But the offence type matters: Kingston’s home burglary count actually fell slightly while vehicle burglary rose strongly.
Home burglary is a very different story from total property crime
Greater Hobart home burglary has moved much less dramatically than total property offending.
The five divisions recorded 502 home burglaries in 2025–26. That is down approximately 13.1% from the revised 2024–25 performance total of 578, and almost 29% below the 706 recorded at the 2022–23 peak.
Compared with 2020–21, however, the current total is only about 4% higher. In other words, the five-year rise in broad property crime is not primarily a story of homes suddenly being burgled at the same pace as other property offences have grown.
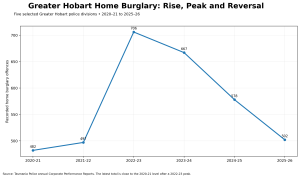
The latest division movements are mostly favourable: Bridgewater home burglary fell 28.2%, Clarence 17.7%, Glenorchy 13.7% and Kingston 3.6%. Hobart was the exception, rising modestly from 117 to 124 offences.
Vehicle crime is becoming more important relative to burglary
This is one of the clearest findings in the Greater Hobart data.
Across the five divisions in 2025–26 there were 805 stolen-motor-vehicle offences and 777 motor-vehicle-burglary offences, compared with 502 home burglaries.
Combined, those two published vehicle indicators total 1,582 offences — more than three times the home-burglary count. Five years earlier, the same two vehicle indicators totalled about 1,024 offences versus 482 home burglaries, a ratio just over two to one.
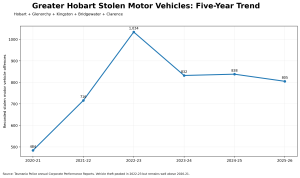
Stolen vehicles fell slightly across the five divisions in the latest year overall, but local direction varies. Hobart rose 9.9%, Glenorchy 5.6% and Kingston 11.8%. Bridgewater fell 7.1% and Clarence fell 30.3%.
Motor-vehicle burglary — which is the closest published divisional measure to theft from or unlawful entry into vehicles — rose sharply in Hobart (+28.0%) and Kingston (+46.6%), but fell in Bridgewater (-32.0%) and Clarence (-12.4%).
Which parts of Greater Hobart have changed most over five years?
The five-year comparison below uses 2020–21 as the starting point. Because that period was affected by COVID-era changes in mobility and activity, the percentages should not be interpreted as a normal pre-pandemic baseline.
| Police division | Property offences: 5-year change | Home burglary: 5-year change | Stolen vehicles: 5-year change |
|---|---|---|---|
| Hobart | +78.4% | +27.8% | +105.3% |
| Glenorchy | +38.2% | -25.5% | +44.4% |
| Kingston | +94.8% | +35.0% | +129.7% |
| Bridgewater | +50.6% | +3.0% | +28.4% |
| Clarence | +73.1% | +20.0% | +69.0% |
Kingston has the largest five-year increase in broad property offences, almost doubling from 671 to 1,307. Hobart and Clarence also show large increases. Yet the home-burglary changes are much smaller and mixed: Glenorchy is below its 2020–21 burglary count, while Bridgewater is almost unchanged.
Vehicle theft is the more consistent long-term pressure. Every one of the five divisions has more stolen-motor-vehicle offences than in 2020–21, with the largest proportional increases in Kingston and Hobart.
What types of crime dominate Greater Hobart?
Tasmania Police does not publish every stealing subtype by division in the annual performance table. The most recent official Crime Statistics Supplement, for 2024–25, reports statewide 3,077 Stealing-General offences, down 3%, and says shoplifting increased 8% and remained on a significant upward trend. But no equivalent five-division shoplifting table is published in the 2025–26 Corporate Performance Report.
For that reason, retail theft is discussed at state level rather than falsely allocated to Hobart, Glenorchy, Kingston, Bridgewater or Clarence.
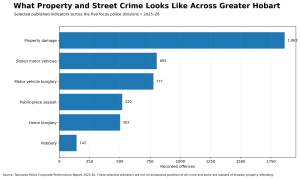
Among the selected divisional indicators, property damage is the largest category, followed by stolen vehicles and motor-vehicle burglary. Home burglary is smaller than either vehicle measure.
Public-place assault is included because it is the clearest divisional assault indicator published in the annual performance report. Hobart recorded 226 public-place assaults in 2025–26, Clarence 95, Glenorchy 93, Bridgewater 72 and Kingston 34. Hobart and Clarence increased year-on-year while the other three divisions declined.
Robbery remains relatively low in absolute numbers: 65 in Hobart, 30 in Glenorchy, 27 in Clarence, 15 in Bridgewater and five in Kingston. Hobart’s latest robbery count rose from 44 to 65, while Glenorchy and Bridgewater fell substantially.
How does Hobart compare with Tasmania overall?
A valid population comparison is possible at police-district level, because Tasmania Police publishes district populations based on ABS estimates. In 2025 it lists the Southern District population as 299,777 and Tasmania’s total population as 576,261.
This is preferable to dividing the five focus divisions by Greater Hobart’s ABS population of 255,250. The boundaries do not match: the Southern police divisions extend beyond the ABS Greater Hobart capital-city geography. Using the capital-city denominator against police-division counts would create a misleading rate.
| Indicator | Southern District count | Southern rate /100k | Tasmania count | Tasmania rate /100k |
|---|---|---|---|---|
| Offences against property | 13,480 | 4,496.7 | 24,772 | 4,298.7 |
| Home burglary | 530 | 176.8 | 1,077 | 186.9 |
| Motor vehicle burglary | 813 | 271.2 | 1,458 | 253.0 |
| Stolen motor vehicles | 842 | 280.9 | 1,323 | 229.6 |
| Offences against person | 3,006 | 1,002.7 | 6,777 | 1,176.0 |
| Robbery | 144 | 48.0 | 273 | 47.4 |
Sources: Tasmania Police Corporate Performance Report 2025–26 and ABS-derived district population estimates.
The Southern District’s overall property-offence rate is slightly above the state rate: approximately 4,497 versus 4,299 per 100,000. But its home-burglary rate is slightly lower than Tasmania overall. Vehicle crime moves the other way: both motor-vehicle burglary and stolen-motor-vehicle rates are higher in the Southern District than statewide.
Offences against the person are lower on a population-adjusted basis in the Southern District than Tasmania overall. That is another reason a single “crime rate” is not a useful summary of whether Hobart is safer or worse.
How Tasmania compares with Australia on household crime
ABS Crime Victimisation gives a second perspective because it measures households that experienced crime, whether or not every incident became a police-recorded offence.
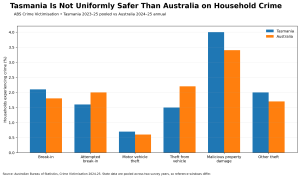
Tasmania is not uniformly safer than Australia. The latest ABS state estimate puts household break-in at 2.1% in Tasmania versus 1.8% nationally. Motor-vehicle theft is 0.7% versus 0.6%, malicious property damage 4.0% versus 3.4%, and other theft 2.0% versus 1.7%.
On the other hand, theft from a motor vehicle is lower in Tasmania — 1.5% of households versus 2.2% nationally — and attempted break-in is also lower, 1.6% versus 2.0%.
The long-term Tasmanian household series is encouraging. ABS reports that between 2013–15 and 2023–25, break-in declined from 3.0% to 2.1%, theft from vehicles from 2.1% to 1.5%, malicious property damage from 6.9% to 4.0%, and other theft from 3.1% to 2.0%.
Why this article does not rank “Hobart’s 50 safest suburbs”
Because the official data does not support that level of precision.
Tasmania Police’s annual public performance tables report crime by police division. Those divisions are operational geographies, not one-suburb units. The official station directory makes this clear: the Kingston Division includes locations outside the suburb of Kingston, while Bridgewater Division includes stations and communities well beyond Bridgewater itself.
The public Reporting Dashboard is valuable for current reporting, but the reproducible annual tables used here do not provide a stable population denominator for every division or suburb. Nor should an ABS Greater Hobart population be divided into five police-division offence totals when the boundaries do not match.
Publishing a “safest suburb” list anyway would create false precision. Small-area counts are also volatile: five robberies versus ten can produce a 100% change without describing a broad community-level shift.
This article therefore uses:
- division counts for Hobart, Glenorchy, Kingston, Bridgewater and Clarence;
- Southern District rates where Tasmania Police supplies a matching ABS-based population;
- state Crime Statistics Supplement data for official offence definitions and statewide trends; and
- ABS Crime Victimisation for household experience and national comparison.
That methodological restraint is more useful than a longer ranking with weaker evidence.
Methodology and limitations
Tasmania Police’s Crime Statistics Supplement counts criminal offences reported to or detected by police. Tasmania applies the National Crime Recording Standard. The basic counting unit is the victim: one unique offence is counted for each victim per incident, regardless of the number of offenders. Statistics are compiled according to when the offence becomes known to police, which may differ from when it occurred.
The latest 2025–26 divisional figures come from the Corporate Performance Report. Tasmania Police explicitly warns that this report is designed primarily for internal performance management and can differ from official departmental figures. The latest formal Crime Statistics Supplement currently covers 2024–25. Minor differences between an annual CPR and a later statistical supplement are therefore possible.
Five-year comparisons use 2020–21. This was an unusual pandemic period and should be treated as a low-activity baseline rather than an ordinary year. The article therefore also shows the intervening annual trend rather than relying only on endpoint percentages.
Retail theft is included only where published. The 2024–25 supplement reports that shoplifting increased 8% statewide, but the current 2025–26 CPR does not publish a shoplifting count for each of the five focus divisions.
Greater Hobart’s ABS population was 255,250 at 30 June 2025, but it is used only as metropolitan context. The police divisions used in this analysis do not align exactly with the Greater Hobart GCCSA, so no artificial five-division “rate per 100,000 Greater Hobart residents” is calculated.
The bottom line
Greater Hobart’s crime picture in 2026 is neither a simple deterioration nor a simple improvement.
Broad property crime has fallen for two years from its 2023–24 peak, but remains well above the COVID-affected 2020–21 level. Home burglary has fallen much more convincingly from its 2022–23 peak and is now close to its five-year starting level. Vehicle-related crime remains the more persistent long-term pressure.
Among the five focus divisions, Kingston recorded the largest latest-year increase in property offences, while Bridgewater recorded the largest fall. Hobart’s property volume rose slightly and remains the largest in absolute terms. Glenorchy and Clarence both improved on the broad property measure.
Compared with Australia, Tasmania is not universally “low crime”: household break-in and property-damage victimisation are somewhat higher than the national estimates, while theft from vehicles is lower.
The useful conclusion is therefore not that one Hobart suburb is “dangerous” and another is “safe”. It is that different official police divisions are moving in different directions, and the offence mix — especially vehicle crime versus home burglary — matters more than a single headline crime count.