

















2026 Sydney Crime Statistics: The Safest and Highest-Risk Suburbs for Break-Ins, Car Theft and Property Crime Leave a comment
Sydney crime statistics are often reduced to lists of the “safest” and “most dangerous” suburbs. Official NSW data shows why that approach can be misleading.
A suburb or council area can record a large number of offences simply because it has more residents, more shops, more parked vehicles or a major transport centre. At the other extreme, dividing crime by residential population can make a CBD or entertainment district look unusually risky because hundreds of thousands of workers, shoppers and visitors use the area without appearing in its resident-population denominator.
This analysis therefore uses both recorded incident counts and population-adjusted rates, and distinguishes carefully between residential areas and major commercial centres.
Data period used in this article
The latest NSW Bureau of Crime Statistics and Research (BOCSAR) data available at publication covers Local Government Areas and Statistical Area Level 4 regions to March 2026. BOCSAR suburb and postcode datasets currently extend through calendar 2025. The datasets were released on 18 June 2026. Source: NSW BOCSAR open criminal-offence datasets.
That timing difference matters. Rather than mix 2025 suburb figures with March 2026 council figures and present them as though they covered the same period, the principal rankings in this article use LGAs and official Sydney statistical regions. Suburb-level limitations are explained separately below.
Is crime in Greater Sydney actually rising or falling?
There is no accurate one-word answer.
BOCSAR reports that Greater Sydney property crime increased significantly by 2.8% over the two years to March 2026, but the longer-term trend remains strongly downward: property crime fell by an average 2.7% per year over the decade to March 2026. Violent offences were statistically stable over the latest two-year period. Source: NSW Recorded Crime Statistics, March Quarter 2026.
Within individual offences, the picture is mixed. Over the two years to March 2026, Greater Sydney recorded statistically significant increases in retail theft (+9.6%) and other stealing (+5.7%), while robbery fell 9.1% and stealing from motor vehicles fell 2.9%. BOCSAR classified the remaining major offence categories as stable. Source: BOCSAR Crime and Policing dashboard.
So the evidence does not support a simple claim that “Sydney is becoming more dangerous”. Some high-volume property offences are rising, others are falling, and residential burglary remains well below levels recorded a decade ago.
Sydney crime snapshot: latest year versus previous year
The table below compares the 12 months to March 2026 with the 12 months to March 2025. Percentage changes are calculated from BOCSAR’s revised incident totals and should not be confused with BOCSAR’s statistical trend tests, which use monthly data and Kendall’s tau-b methodology.
| Crime type | 12 months to Mar 2025 | 12 months to Mar 2026 | Change |
|---|---|---|---|
| Break and enter dwelling | 8,674 | 8,360 | -3.6% |
| Motor vehicle theft | 7,403 | 7,326 | -1.0% |
| Steal from motor vehicle | 14,147 | 13,734 | -2.9% |
| Steal from retail store | 17,510 | 19,191 | +9.6% |
| Other stealing | 22,489 | 23,780 | +5.7% |
| Robbery | 1,280 | 1,163 | -9.1% |
| Malicious damage to property | 24,425 | 23,827 | -2.4% |
| Domestic violence-related assault | 20,214 | 20,049 | -0.8% |
| Non-domestic violence-related assault | 18,788 | 18,759 | -0.2% |
Source: NSW BOCSAR, NSW Recorded Crime Statistics, March Quarter 2026, Tables 2.3 and 2.4. Periods: April 2024–March 2025 and April 2025–March 2026. Source: BOCSAR March Quarter 2026 report.
The standout movement is retail theft. Sydney recorded 1,681 more retail-theft incidents in the latest 12-month period, while residential break-ins, vehicle theft, theft from vehicles, robbery and malicious damage all finished below their previous-year totals.
Which Sydney areas recorded the most residential break-ins?
Raw incident totals tell us where police recorded the largest volume of residential break-and-enter incidents. They do not automatically tell us where an individual household faced the highest probability of victimisation.
10 Greater Sydney LGAs with the most residential break-ins
| LGA | Break-ins | Rate per 100,000 residents |
|---|---|---|
| Central Coast | 747 | 210.5 |
| Parramatta | 703 | 255.7 |
| Blacktown | 695 | 158.4 |
| Sydney | 681 | 287.0* |
| Penrith | 480 | 209.9 |
| Canterbury-Bankstown | 473 | 122.8 |
| Liverpool | 450 | 176.5 |
| Cumberland | 436 | 172.7 |
| Inner West | 346 | 181.2 |
| Campbelltown | 299 | 158.8 |
Source: BOCSAR LGA incident tables and Local Area Rankings. Period: April 2025–March 2026. Source: BOCSAR Local Area Rankings.
*BOCSAR does not rank the Sydney LGA rate in its LGA ranking dataset. The City of Sydney has a resident population far smaller than its daily worker, visitor, retail and entertainment population, making a conventional per-resident crime rate a poor measure of personal risk. BOCSAR specifically warns about this problem.
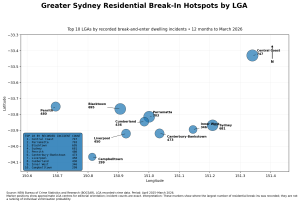
Graphic 2. Greater Sydney residential break-in hotspots by LGA. Source: NSW BOCSAR. Period: April 2025–March 2026. Marker positions show approximate LGA centres for orientation; incident counts are exact.
The comparison between Blacktown and Parramatta illustrates why counts and rates should be published together. Blacktown recorded almost as many break-ins as Parramatta — 695 versus 703 — yet Parramatta’s population-adjusted rate was considerably higher at 255.7 per 100,000 compared with 158.4 in Blacktown.
Which areas had the lowest residential break-in rates?
Among Greater Sydney LGAs with a BOCSAR-comparable rate, the lowest recorded rates were Camden (55.3 per 100,000), Northern Beaches (62.8), Ku-ring-gai (71.7), Wollondilly (71.9), The Hills (77.0), Hornsby (79.4) and Sutherland (79.6). These figures describe recorded residential burglary only; they are not an overall “safety score”. Source: BOCSAR Local Area Rankings.
Where are the most vehicles being stolen?
10 Greater Sydney LGAs with the most motor vehicle thefts
| LGA | Vehicle thefts | Rate per 100,000 |
|---|---|---|
| Blacktown | 687 | 156.5 |
| Canterbury-Bankstown | 621 | 161.2 |
| Central Coast | 589 | 166.0 |
| Sydney | 584 | 246.1* |
| Cumberland | 480 | 190.2 |
| Liverpool | 466 | 182.8 |
| Penrith | 450 | 196.8 |
| Parramatta | 368 | 133.8 |
| Campbelltown | 312 | 165.7 |
| Inner West | 308 | 161.3 |
Source: BOCSAR Local Area Rankings and LGA recorded-crime data. Period: April 2025–March 2026. Source: BOCSAR March Quarter 2026 report.
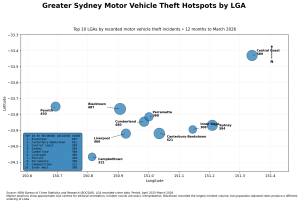
The largest count does not equal the highest residential risk. Ku-ring-gai, Hornsby, Willoughby, The Hills, Sutherland and Blue Mountains all recorded motor-vehicle-theft rates below 50 per 100,000 in the current BOCSAR ranking dataset. Source: BOCSAR Local Area Rankings.
Where is theft from parked vehicles most common?
Stealing from a motor vehicle remains substantially more common than stealing the vehicle itself. Greater Sydney recorded 13,734 theft-from-vehicle incidents in the year to March 2026, compared with 7,326 motor vehicle thefts. Source: BOCSAR March Quarter 2026 report.
10 Greater Sydney LGAs with the most theft-from-vehicle offences
| LGA | Incidents | Rate per 100,000 |
|---|---|---|
| Central Coast | 1,174 | 330.9 |
| Blacktown | 1,143 | 260.5 |
| Canterbury-Bankstown | 1,080 | 280.3 |
| Cumberland | 978 | 387.5 |
| Parramatta | 955 | 347.3 |
| Sydney | 864 | 364.1* |
| Penrith | 841 | 367.8 |
| Liverpool | 838 | 328.7 |
| Campbelltown | 612 | 325.0 |
| Inner West | 572 | 299.6 |
The lowest theft-from-vehicle rates among Greater Sydney LGAs included Ku-ring-gai (97.4), The Hills (101.6), Sutherland (101.8) and Hornsby (104.6) per 100,000. Source: BOCSAR Local Area Rankings.
Which areas have changed most over five years?
BOCSAR changed its standard long-term reporting from five-year to ten-year trends in 2024 because COVID-19 restrictions caused unusually sharp disruptions to crime patterns. Source: BOCSAR March Quarter 2026 report.
To answer the five-year local-area question consistently, this analysis uses a transparent property-security basket comprising five offences for which comparable LGA data are available at both endpoints:
break and enter dwelling + motor vehicle theft + steal from motor vehicle + retail theft + malicious damage to property.
This is an article-specific measure, not BOCSAR’s official “property offences” category. BOCSAR’s formal property category includes additional stealing offences and does not include malicious damage.
The comparison below measures recorded incident volume, not population-adjusted personal risk, between April 2020–March 2021 and April 2025–March 2026.
10 largest five-year increases in the property-security basket
| LGA | 2021 incidents | 2026 incidents | Change |
|---|---|---|---|
| Strathfield | 531 | 809 | +52.4% |
| Sydney | 5,165 | 7,229 | +40.0% |
| Randwick | 1,500 | 1,953 | +30.2% |
| Canada Bay | 773 | 983 | +27.2% |
| Parramatta | 3,593 | 4,462 | +24.2% |
| Ryde | 1,195 | 1,460 | +22.2% |
| Wollondilly | 357 | 436 | +22.1% |
| Georges River | 1,440 | 1,702 | +18.2% |
| Bayside | 1,941 | 2,227 | +14.7% |
| Camden | 987 | 1,126 | +14.1% |
10 largest five-year decreases
| LGA | 2021 incidents | 2026 incidents | Change |
|---|---|---|---|
| Blue Mountains | 1,080 | 739 | -31.6% |
| Mosman | 277 | 196 | -29.2% |
| Ku-ring-gai | 774 | 555 | -28.3% |
| Northern Beaches | 2,589 | 1,871 | -27.7% |
| Hornsby | 1,271 | 967 | -23.9% |
| Lane Cove | 325 | 274 | -15.7% |
| Hunters Hill | 140 | 119 | -15.0% |
| Fairfield | 2,542 | 2,261 | -11.1% |
| Burwood | 816 | 733 | -10.2% |
| Sutherland | 2,161 | 1,943 | -10.1% |
Source: Security Wholesalers calculations from BOCSAR’s archived March 2021 LGA incident table and March 2026 LGA incident table.
These movements need context. Strathfield’s percentage increase starts from a comparatively small base, while Sydney LGA’s growth includes an unusually large concentration of retail, employment, entertainment and visitor activity. Growing LGAs can also record more incidents simply because there are more residents, vehicles and premises exposed to crime.
How different are Western, Northern, Eastern and Southern Sydney?
The most defensible comparison is BOCSAR’s official SA4 rate data rather than informal definitions of “Western Sydney” or “Northern Sydney”.
Crime type by area of Sydney — incidents per 100,000 residents
| BOCSAR statistical area | Break-in | Vehicle theft | Theft from vehicle | Retail theft | Malicious damage |
|---|---|---|---|---|---|
| City & Inner South | 239.9 | 230.3 | 360.1 | 1,004.1 | 819.5 |
| Eastern Suburbs | 163.7 | 146.8 | 225.2 | 384.6 | 385.4 |
| Inner West | 202.5 | 139.8 | 263.4 | 356.7 | 339.8 |
| Inner South West | 119.4 | 129.9 | 233.7 | 210.1 | 340.6 |
| South West | 128.9 | 155.6 | 270.0 | 234.8 | 415.4 |
| Outer South West | 116.6 | 147.1 | 251.4 | 215.6 | 519.5 |
| Blacktown | 160.9 | 157.5 | 264.0 | 431.2 | 555.1 |
| Parramatta | 213.8 | 172.6 | 392.4 | 351.8 | 406.1 |
| Outer West & Blue Mountains | 179.0 | 153.0 | 297.4 | 476.1 | 624.6 |
| North Sydney & Hornsby | 104.7 | 42.6 | 129.0 | 266.2 | 224.8 |
| Northern Beaches | 62.8 | 70.5 | 135.2 | 172.8 | 249.7 |
| Baulkham Hills & Hawkesbury | 77.1 | 57.3 | 92.0 | 176.1 | 213.6 |
| Ryde | 156.3 | 71.0 | 181.4 | 255.1 | 242.6 |
| Sutherland | 80.1 | 47.6 | 102.0 | 254.9 | 332.8 |
| Greater Sydney | 150.4 | 131.8 | 247.1 | 345.3 | 428.8 |
Source: BOCSAR Table 2.5. Period: April 2025–March 2026. Rates per 100,000 population. Source: BOCSAR March Quarter 2026 report.
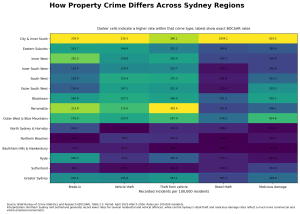
Several differences are substantial. Northern Beaches, Baulkham Hills/Hawkesbury, North Sydney/Hornsby and Sutherland sit well below the Greater Sydney rate for several residential and vehicle-related property offences. Parramatta and the Outer West have higher theft-from-vehicle rates, while City & Inner South is dominated by a completely different commercial and visitor profile.
There is therefore no evidence for a simple “Western Sydney bad, Northern Sydney good” rule. Different parts of Sydney have different offence profiles, and even adjacent LGAs can diverge materially.
How Sydney CBD differs from ordinary residential suburbs
BOCSAR’s City & Inner South statistical area corresponds to Sydney LGA in its Greater Sydney grouping. It is the closest current regional proxy in the standard report for analysing the central city, but it should not be interpreted as the CBD alone.
In the year to March 2026, City & Inner South recorded 3,650 retail thefts, 2,979 malicious-damage incidents, 1,309 thefts from vehicles, 872 dwelling break-ins and 837 motor vehicle thefts. Its retail-theft rate of 1,004.1 per 100,000 residents was almost three times the Greater Sydney rate of 345.3. Source: BOCSAR March Quarter 2026 report.
That does not mean a resident walking through the CBD is three times as likely to become a crime victim.
BOCSAR specifically warns that residential-population rates can overstate crime levels in places such as Sydney city centre because their “user population” — workers, tourists, shoppers, commuters and nightlife visitors — is much larger than their resident population. Source: BOCSAR definitions and explanations.
For the CBD, raw volume, offence type and activity level are generally more informative than a simplistic residential rate.
Can Sydney’s “safest suburbs” actually be ranked?
Not reliably enough to publish a definitive suburb-wide league table.
BOCSAR does publish suburb and postcode counts, but its current bulk suburb/postcode series runs only through 2025, compared with March 2026 for LGAs. More importantly, BOCSAR suppresses suburb rates when the population is below 2,000 or suitable ABS population data are unavailable. Following boundary changes, BOCSAR says around 80% of suburbs do not display rate or trend information. Source: BOCSAR criminal-offence open datasets.
BOCSAR also warns that rate maps should be treated as a guide rather than a definitive measurement of personal risk, particularly in high-visitor locations. Source: BOCSAR definitions and explanations.
For that reason, this article does not take raw 2025 suburb counts, divide them by unsuitable or unavailable population estimates and publish a “10 safest Sydney suburbs” list. That would create precisely the type of misleading statistic this analysis is designed to avoid.
At the broader, population-supported LGA level, however, the current data consistently identifies parts of northern Sydney, the Northern Beaches, The Hills and Sutherland among the lower-rate areas for several common property offences. That is a much more defensible conclusion than claiming one suburb is Sydney’s universal “safest”.
Methodology: how to read Sydney crime statistics correctly
Recorded incidents are not the same as people victimised
BOCSAR statistics are criminal incidents reported to or detected by NSW Police and recorded in the Computerised Operational Policing System. They therefore do not include crimes that were never reported to or detected by police. Source: BOCSAR March Quarter 2026 report.
One criminal event can also contain multiple criminal incidents. BOCSAR’s default unit is the criminal incident, except for murder and manslaughter, where victims are counted.
Counts and rates answer different questions
A count tells us how much recorded crime occurred in an area.
A rate per 100,000 residents adjusts the number for residential population and is usually more useful when comparing differently sized residential areas. BOCSAR calculates its rates using ABS population data. Source: BOCSAR definitions and explanations.
Neither is perfect. A rate may be unstable in a small area and can be seriously distorted where the number of visitors, workers or shoppers is much larger than the resident population.
Why ABS population figures are not simply divided into every table
The ABS estimated Sydney’s Greater Capital City Statistical Area population at 5,638,830 at 30 June 2025. Source: Australian Bureau of Statistics, Regional population.
For the geographic rates in this article, however, we use BOCSAR’s published rates rather than independently dividing offences by that citywide figure. BOCSAR uses its own ABS-aligned population series for the relevant LGA and Statistical Area boundaries, which avoids mismatched geographic denominators.
Why a suburb-level “safest” ranking is not published
BOCSAR’s current criminal-incident data extends to March 2026 for LGAs but only through 2025 for suburbs and postcodes. Suburb population data are available only from 2012, rates are suppressed for populations below 2,000, some suburbs have no suitable ABS population figure, and BOCSAR says approximately 80% of suburbs do not display rate or trend information under the current boundary framework.
Publishing a league table based only on raw suburban offences would favour tiny residential suburbs, while calculating unofficial rates would create false precision.
Which crimes matter most for houses, apartments and businesses?
BOCSAR defines break-and-enter dwelling as applying to residential premises including houses, home units and villas, while non-dwelling break-and-enter covers premises such as shops, wholesale premises, industrial buildings and educational facilities. Source: BOCSAR definitions and explanations.
| Property type | Most relevant recorded offences | Practical implication |
|---|---|---|
| Detached houses | Break and enter dwelling; vehicle theft; theft from vehicle | Entry points, garages, driveways and accessible vehicle keys matter most. |
| Apartments | Break and enter dwelling; vehicle/theft-from-vehicle offences | Common entrances, basement parking, storage cages and shared access add different exposure points. |
| Retail businesses | Retail theft; break and enter non-dwelling; malicious damage | Shop-floor theft and after-hours access are separate problems and need different controls. |
| Offices | Break and enter non-dwelling; theft; malicious damage | Access control and protection of equipment are usually more relevant than retail-theft controls. |
| Warehouses/trade premises | Break and enter non-dwelling; vehicle theft; theft from vehicle | Perimeter access, loading areas, tools, fleet vehicles and keys deserve particular attention. |
This is another reason a single “crime rate” is of limited value. A homeowner deciding whether to buy in an area is interested in a different combination of offences from a retailer considering a shopfront lease.
Practical security implications for Sydney homes and businesses
Crime statistics are most useful when they help identify the type of exposure, rather than being used to create fear about a suburb.
For a house, residential burglary and vehicle-related offences are generally the most directly relevant categories. Practical priorities include strong door and window locking, keeping vehicle and garage keys away from easily accessible entry areas, maintaining visibility around entrances, securing garages and sheds, and using lighting, alarms or surveillance where appropriate.
For apartments, the individual unit is only part of the security environment. Shared entrances, intercom access, basement car parks, storage cages, parcel areas and pedestrian garage doors can all create common-access points. Residents and strata managers should therefore think about both private-unit security and building-wide access management.
Businesses face a different pattern. Greater Sydney’s current increase in retail theft means shop-floor loss prevention deserves particular attention for retailers, while warehouses and commercial premises may be more concerned with non-dwelling break-ins, vehicles, tools, stock and after-hours access. BOCSAR recorded 19,191 retail theft incidents and 23,827 malicious-damage incidents across Greater Sydney in the 12 months to March 2026. Source: BOCSAR March Quarter 2026 report.
The appropriate response should be proportionate to the property, operating hours and actual offence profile — not simply to whether an area appears near the top of a raw crime table.
Frequently asked questions
Is Sydney getting more dangerous in 2026?
Not across every crime type. BOCSAR found Greater Sydney property offences increased 2.8% over the latest two-year period, but the ten-year property-crime trend remained downward at an average 2.7% decline per year. Retail theft and other stealing increased recently, while robbery and theft from vehicles declined and most other major categories were statistically stable.
What is the safest part of Sydney?
There is no single official “safest part of Sydney”. Different offences produce different rankings. In the latest data, Northern Beaches, Baulkham Hills/Hawkesbury, North Sydney/Hornsby and Sutherland recorded comparatively low rates across several property-crime categories, but no one measure captures overall safety.
Which Sydney areas have the most break-ins?
For the 12 months to March 2026, the largest LGA counts were Central Coast (747), Parramatta (703), Blacktown (695), Sydney (681) and Penrith (480). These are incident totals rather than household-risk rankings.
Where are cars most likely to be stolen in Sydney?
If measured by number of recorded vehicle thefts, Blacktown recorded the most in the latest LGA data, followed by Canterbury-Bankstown, Central Coast, Sydney and Cumberland. “Most likely”, however, requires a suitable exposure denominator such as residents or vehicles, so raw counts should not be interpreted literally as probability.
Is Sydney CBD dangerous?
Crime is concentrated differently in central Sydney, particularly retail theft, other stealing and malicious damage. But BOCSAR explicitly warns that City of Sydney per-resident rates can be misleading because its worker, visitor and entertainment population is much larger than its resident population. The CBD should therefore be analysed by offence type and activity rather than labelled “dangerous” from a residential rate.
Is Western Sydney more dangerous than Northern Sydney?
That is too broad a generalisation. Blacktown, Parramatta and Outer West/Blue Mountains record higher rates than northern Sydney for several property offences, but the differences vary substantially by crime type. The South-West also differs from Blacktown and Parramatta rather than forming one uniform Western Sydney pattern.
Are break-ins increasing in Sydney?
Not in the latest figures. Greater Sydney recorded 8,360 dwelling break-ins in the 12 months to March 2026, down from 8,674 in the previous 12 months. BOCSAR’s two-year test classifies residential break-and-enter as statistically stable, while its ten-year Greater Sydney trend shows an average annual decline of 6.1%.
What crime is increasing fastest in Sydney?
Among the major offences examined here, retail theft is the clearest current increase. Greater Sydney recorded 19,191 retail-theft incidents in the year to March 2026, 9.6% more than the previous year’s 17,510, and BOCSAR also identified a statistically significant 9.6% increase over its two-year trend period.
The bottom line
Sydney’s 2026 crime data tells a more useful story than a “good suburb versus bad suburb” ranking.
Residential burglary remains on a long-term downward trajectory. Retail theft is the clearest current growth problem. Vehicle-related crime remains substantial but is not uniformly increasing. And the geography of crime differs materially between central Sydney, Western Sydney, northern districts, the Inner West, the Eastern Suburbs, South-West Sydney and Sutherland.
The most important lesson for anyone interpreting local crime statistics is simple: look at the offence, the count, the population-adjusted rate, the trend and the type of area together.
A high raw offence count does not automatically mean a suburb is unsafe. A high per-resident rate does not automatically mean an individual faces a high probability of victimisation. And no single crime statistic can tell residents, buyers or businesses everything they need to know about an area.
That distinction is what makes official BOCSAR data useful — and what prevents a crime-statistics article from becoming another misleading list of Sydney’s supposedly “dangerous suburbs”.